
Page 43 - TD-2-1
P. 43
Tumor Discovery Breast cancer optical differentiation
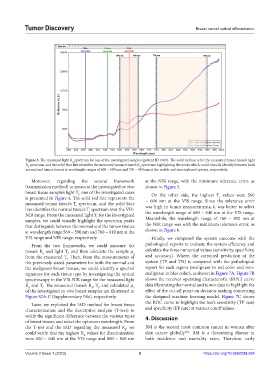
Figure 3. The measured light R spectrum for one of the investigated samples (patient ID 1009). The solid red line is for the measured tumor tissue’s light
d
R spectrum, and the solid blue line identifies the measured normal tissue’s R spectrum highlighting the peaks which could visually identify between both
d
d
normal and tumor tissues at wavelength ranges of 600 ~ 680 nm and 750 ~ 960 nm at the visible and near-infrared spectra, respectively.
Moreover, regarding the second framework at the NIR range, with the minimum tolerance error, as
(transmission method) to measure the investigated ex vivo shown in Figure 5.
breast tissue sample’s light T, one of the investigated cases On the other side, the highest T values were 560
r
is presented in Figure 4. The solid red line represents the ~ 600 nm at the VIS range. Since the tolerance error
r
measured tumor tissue’s T spectrum, and the solid blue
r
line identifies the normal tissue’s T spectrum over the VIS- was high in tumor measurements, it was better to select
r
NIR range. From the measured light T for the investigated the wavelength range of 600 ~ 640 nm at the VIS range.
r
samples, we could visually highlight the spectrum peaks Meanwhile, the wavelength range of 760 ~ 800 nm at
that distinguish between the normal and the tumor tissues the NIR range was with the minimum tolerance error, as
at wavelength range 560 ~ 590 nm and 760 ~ 810 nm at the shown in Figure 6.
VIS range and NIR range, respectively. Finally, we compared the system outcome with the
From the two frameworks, we could measure the pathological reports to evaluate the system efficiency and
tissue’s R and light T, and then calculate the sample µ a calculate the three numerical values (sensitivity, specificity,
r
d
from the measured T. Then, from the measurements of and accuracy). Where, the corrected prediction of the
r
the previously stated parameters for both the normal and system (TP and TN) is compared with the pathological
the malignant breast tissues, we could identify a spectral report for each region (malignant in red color and non-
signature for each tissue type by investigating the optical malignant in blue color), as shown in Figure 7A. Figure 7B
spectroscopy in the VIS-NIR range for the measured light shows the receiver operating characteristic (ROC) curve
R and T. The measured tissue’s R , T, and calculated µ a data illustrating the normal and tumor data to highlight the
d
d
r
r
of the investigated ex vivo breast samples are illustrated in effect of the cut-off point on decision-making concerning
Figure S2A-C (Supplementary File), respectively. the designed machine learning model. Figure 7C shows
Later, we exploited the IAD method for breast tissue the ROC curve to highlight the test’s sensitivity (TP rate)
characterization and the descriptive analysis (T-test) to and specificity (FP rate) at various cutoff values.
verify the significant difference between the various types 4. Discussion
of breast tissues and select the optimum wavelength. From
the T-test and the IAD regarding the measured R , we BM is the second most common cancer in women after
d
[63]
could verify that the highest R values for discrimination skin cancer globally . BM is a threatening disease in
d
were 600 ~ 640 nm at the VIS range and 800 ~ 840 nm both incidence and mortality rates. Therefore, early
Volume 2 Issue 1 (2023) 8 https://doi.org/10.36922/td.258