
Page 44 - TD-2-1
P. 44
Tumor Discovery Breast cancer optical differentiation
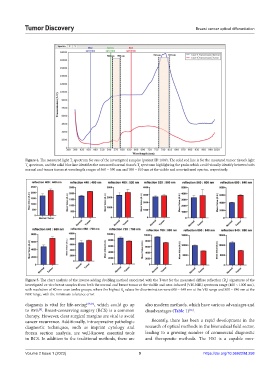
Figure 4. The measured light T spectrum for one of the investigated samples (patient ID 1009). The solid red line is for the measured tumor tissue’s light
r
T spectrum, and the solid blue line identifies the measured normal tissue’s T spectrum highlighting the peaks which could visually identify between both
r
r
normal and tumor tissues at wavelength ranges of 560 ~ 590 nm and 760 ~ 810 nm at the visible and near-infrared spectra, respectively.
Figure 5. The chart analysis of the inverse adding doubling method associated with the T-test for the measured diffuse reflection (R ) signatures of the
d
investigated ex vivo breast samples from both the normal and breast tumor at the visible and near-infrared (VIS-NIR) spectrum range (400 ~ 1000 nm),
with resolution of 40 nm over twelve groups, where the highest R values for discrimination were 600 ~ 640 nm at the VIS range and 800 ~ 840 nm at the
d
NIR range, with the minimum tolerance error.
diagnosis is vital for life-saving [64,65] , which could go up also modern methods, which have various advantages and
to 95% . Breast-conserving surgery (BCS) is a common disadvantages (Table 1) .
[8]
[66]
therapy. However, clear surgical margins are vital to avoid
cancer recurrence. Additionally, intraoperative pathologic Recently, there has been a rapid development in the
diagnostic techniques, such as imprint cytology and research of optical methods in the biomedical field sector,
frozen section analysis, are well-known essential tools leading to a growing number of commercial diagnostic
in BCS. In addition to the traditional methods, there are and therapeutic methods. The HSI is a capable non-
Volume 2 Issue 1 (2023) 9 https://doi.org/10.36922/td.258