
Page 45 - TD-2-1
P. 45
Tumor Discovery Breast cancer optical differentiation
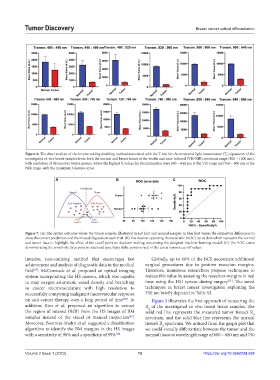
Figure 6. The chart analysis of the inverse adding doubling method associated with the T-test for the measured light transmission (T) signatures of the
r
investigated ex vivo breast samples from both the normal and breast tumor at the visible and near-infrared (VIS-NIR) spectrum range (400 ~ 1000 nm),
with resolution of 40 nm over twelve groups, where the highest T values for discrimination were 600 ~ 640 nm at the VIS range and 760 ~ 800 nm at the
r
NIR range, with the minimum tolerance error.
A B C
Figure 7. (A) The system outcome where the tumor samples illustrated in red font and normal samples in blue font versus the estimation differences to
show the correct prediction and the missed diagnosis in each trial. (B) The receiver operating characteristic (ROC) curve data which represent the normal
and tumor data to highlight the effect of the cutoff point on decision-making concerning the designed machine learning model. (C) The ROC curve
demonstrating the sensitivity (true positive rate) and specificity (false positive rate) of the test at various cut-off values.
invasive, non-ionizing method that encourages fast Globally, up to 40% of the BCS necessitate additional
achievement and analysis of diagnostic data in the medical surgical procedures due to positive resection margins.
field . McCormack et al. proposed an optical imaging Therefore, numerous researchers propose techniques to
[67]
system incorporating the HS camera, which was capable reduce this value by assessing the resection margins in real
[71]
to map oxygen saturation, vessel density and branching time using the HSI system during surgery . The novel
in cancer microvasculature with high resolution to techniques in breast cancer investigation exploiting the
successfully computing malignant microvascular response HSI are briefly depicted in Table S3.
on anti-cancer therapy over a long period of time . In Figure 3 illustrates the first approach of measuring the
[68]
addition, Kim et al. proposed an algorithm to extract R of the investigated ex vivo breast tissue samples. The
d
the region of interest (ROI) from the HS images of BM solid red line represents the measured tumor tissue’s R
d
[69]
samples instead of the visual or manual inspection . spectrum, and the solid blue line represents the normal
Moreover, Pourreza-Shahri et al. suggested a classification tissue’s R spectrum. We noticed from the graph plot that
d
algorithm to identify the BM margins in the HS images we could visually differentiate between the tumor and the
with a sensitivity of 98% and a specificity of 99% . normal tissue at wavelength range of 600 ~ 680 nm and 750
[70]
Volume 2 Issue 1 (2023) 10 https://doi.org/10.36922/td.258