
Page 46 - TD-2-1
P. 46
Tumor Discovery Breast cancer optical differentiation
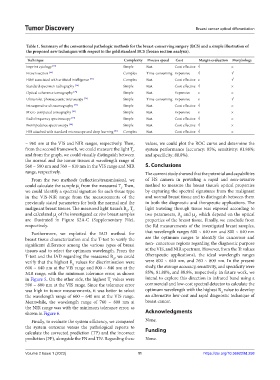
Table 1. Summary of the conventional pathologic methods for the breast-conserving surgery (BCS) and a simple illustration of
the proposed new techniques with respect to the gold standard BCS (frozen section analysis).
Technique Complexity Process speed Cost Margin evaluation Morphology
Imprint cytology [72] Simple Fast Cost-effective √ ×
Frozen section [66] Complex Time-consuming Expensive √ √
H&E associated with artificial intelligence [73] Complex Fast Cost-effective × √
Standard specimen radiography Simple Fast Cost-effective √ ×
[74]
Optical coherence tomography [75] Simple Fast Expensive × ×
Ultraviolet-photoacoustic microscopy [76] Simple Time-consuming Expensive × √
Intraoperative ultrasonography [77] Simple Fast Cost-effective √ ×
Micro-computed tomography [78] Simple Fast Expensive × ×
Radiofrequency spectroscopy [79] Simple Fast Cost-effective √ ×
Bioimpedance spectroscopy [80] Simple Fast Cost-effective √ ×
HSI attached with standard microscope and deep learning [81] Complex Fast Cost-effective √ ×
~ 960 nm at the VIS and NIR ranges, respectively. Then, values, we could plot the ROC curve and determine the
from the second framework, we could measure the light T, system performance (accuracy: 85%; sensitivity: 81.88%;
r
and from the graph, we could visually distinguish between and specificity: 88.8%).
the normal and the tumor tissues at wavelength range of
560 ~ 590 nm and 760 ~ 810 nm in the VIS range and NIR 5. Conclusions
range, respectively. The current study showed that the potential and capabilities
From the two methods (reflection/transmission), we of HS camera in providing a rapid and non-invasive
could calculate the sample µ from the measured T. Then, method to measure the breast tissue’s optical properties
r
a
we could identify a spectral signature for each tissue type by capturing the spectral signatures from the malignant
in the VIS-NIR range from the measurements of the and normal breast tissue and to distinguish between them
previously stated parameters for both the normal and the in both the diagnostic and therapeutic applications. The
malignant breast tissues. The measured light tissue’s R , T, light traveling through tissue was exposed according to
d
r
and calculated µ of the investigated ex vivo breast samples two parameters, R and µ , which depend on the optical
a
a
d
are illustrated in Figure S2A-C (Supplementary File), properties of the breast tissue. Finally, we conclude from
respectively. the Rd measurements of the investigated breast samples,
Furthermore, we exploited the IAD method for that wavelength ranges 600 ~ 640 nm and 800 ~ 840 nm
breast tissue characterization and the T-test to verify the are the optimum ranges to identify the cancerous and
significant difference among the various types of breast non- cancerous regions regarding the diagnostic purpose
tissues and to select the optimum wavelength. From the at the VIS, and NIR spectrum. However, from the Tr values
T-test and the IAD regarding the measured R , we could (therapeutic applications), the ideal wavelength ranges
d
verify that the highest R values for discrimination were were 600 ~ 640 nm, and 760 ~ 800 nm. In the present
d
600 ~ 640 nm at the VIS range and 800 ~ 840 nm at the study, the average accuracy, sensitivity, and specificity were
NIR range, with the minimum tolerance error, as shown 85%, 81.88%, and 88.8%, respectively. In future work, we
in Figure 5. On the other side, the highest T values were intend to explore this direction in infrared band using a
r
590 ~ 600 nm at the VIS range. Since the tolerance error commercial and low-cost spectral detector to calculate the
was high in tumor measurements, it was better to select optimum wavelength with the highest R value to develop
d
the wavelength range of 600 ~ 640 nm at the VIS range. an alternative low-cost and rapid diagnostic technique of
Meanwhile, the wavelength range of 760 ~ 800 nm at breast cancer.
the NIR range was with the minimum tolerance error, as
shown in Figure 6. Acknowledgments
Finally, to evaluate the system efficiency, we compared None.
the system outcome versus the pathological reports to Funding
calculate the corrected prediction (TP) and the incorrect
prediction (FP), alongside the FN and TN. Regarding these None.
Volume 2 Issue 1 (2023) 11 https://doi.org/10.36922/td.258