
Page 32 - TD-3-1
P. 32
Tumor Discovery AI uncovers tumor spatial organization
A B C
D
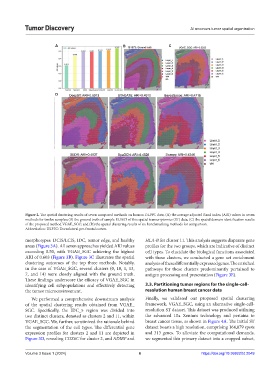
Figure 2. The spatial clustering results of seven compared methods on human DLPFC data; (A) the average adjusted Rand index (ARI) values in seven
methods for twelve samples; (B) the ground truth of sample 15,1673 of this spatial transcriptomics (ST) data; (C) the spatial domain identification results
of the proposed method VGAE_SGC; and (D) the spatial clustering results of six benchmarking methods for comparison.
Abbreviation: DLPFC: Dorsolateral pre-frontal cortex.
morphotypes: DCIS/LCIS, IDC, tumor edge, and healthy HLA-B for cluster 11. This analysis suggests disparate gene
areas (Figure 3A). All seven approaches yielded ARI values profiles for the two groups, which are indicative of distinct
exceeding 0.50, with VGAE_SGC achieving the highest cell types. To elucidate the biological functions associated
ARI of 0.603 (Figure 3B). Figure 3C illustrates the spatial with these clusters, we conducted a gene set enrichment
clustering outcomes of the top three methods. Notably, analysis of these differentially expressed genes. The enriched
in the case of VGAE_SGC, several clusters (0, 10, 1, 13, pathways for these clusters predominantly pertained to
7, and 14) were closely aligned with the ground truth. antigen processing and presentation (Figure 3E).
These findings underscore the efficacy of VGAE_SGC in
identifying cell subpopulations and effectively detecting 3.3. Partitioning tumor regions for the single-cell-
the tumor microenvironment. resolution human breast cancer data
We performed a comprehensive downstream analysis Finally, we validated our proposed spatial clustering
of the spatial clustering results obtained from VGAE_ framework, VGAE_SGC, using an alternative single-cell-
SGC. Specifically, the IDC_5 region was divided into resolution ST dataset. This dataset was produced utilizing
two distinct clusters, denoted as clusters 2 and 11, within the advanced 10x Xenium technology and pertains to
VGAE_SGC. We, further, scrutinized the rationale behind breast cancer tissue, as shown in Figure 4A. The initial ST
the segmentation of the cell types. The differential gene dataset boasts a high resolution, comprising 164,079 spots
expression profiles for clusters 2 and 11 are depicted in and 313 genes. To alleviate the computational demands,
Figure 3D, revealing COX6C for cluster 2, and ADIRF and we segmented this primary dataset into a cropped subset,
Volume 3 Issue 1 (2024) 6 https://doi.org/10.36922/td.2049