
Page 33 - TD-3-1
P. 33
Tumor Discovery AI uncovers tumor spatial organization
A B
C
D E
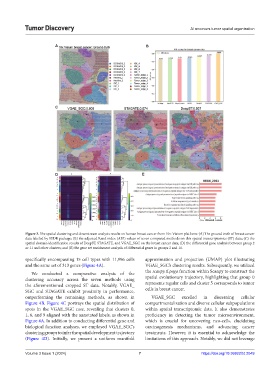
Figure 3. The spatial clustering and downstream analysis results on human breast cancer from 10× Visium platform: (A) The ground truth of breast cancer
data labeled by SEDR package; (B) the adjusted Rand index (ARI) values of seven compared methods on this spatial transcriptomics (ST) data; (C) the
spatial domain identification results of DeepST, STAGATE, and VGAE_SGC on the breast cancer data; (D) the differential gene analysis between group 2
or 11 and other clusters; and (E) the gene set enrichment analysis of differential genes in groups 2 and 11.
specifically encompassing 15 cell types with 11,996 cells approximation and projection (UMAP) plot illustrating
and the same set of 313 genes (Figure 4A). VGAE_SGC’s clustering results. Subsequently, we utilized
We conducted a comparative analysis of the the scanpy.tl.paga function within Scanpy to construct the
clustering accuracy across the seven methods using spatial evolutionary trajectory, highlighting that group 0
the aforementioned cropped ST data. Notably, VGAE_ represents regular cells and cluster 5 corresponds to tumor
SGC and STAGATE exhibit proximity in performance, cells in breast cancer.
outperforming the remaining methods, as shown in VGAE_SGC excelled in discerning cellular
Figure 4B. Figure 4C portrays the spatial distribution of compartmentalization and diverse cellular subpopulations
spots in the VGAE_SGC case, revealing that clusters 0, within spatial transcriptomic data. It also demonstrates
1, 6, and 9 aligned with the annotated labels, as shown in proficiency in detecting the tumor microenvironment,
Figure 4A. In addition to conducting differential gene and which is crucial for uncovering neo-cells, elucidating
biological function analyses, we employed VGAE_SGC’s carcinogenesis mechanisms, and advancing cancer
clustering groups to infer the spatial development trajectory treatments. However, it is essential to acknowledge the
(Figure 4D). Initially, we present a uniform manifold limitations of this approach. Notably, we did not leverage
Volume 3 Issue 1 (2024) 7 https://doi.org/10.36922/td.2049