
Page 47 - TD-3-1
P. 47
Tumor Discovery Energy metabolism in bladder cancer
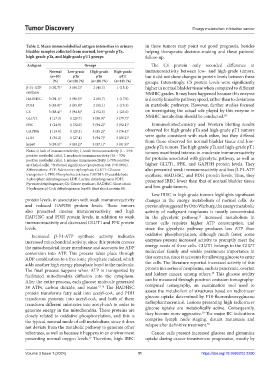
Table 2. Mean immunolabelled antigen intensities in urinary in these tumors may point out good prognosis, besides
bladder samples collected from normal, low‑grade pTa, helping therapeutic decision-making and these patients’
high‑grade pTa, and high‑grade pT1 groups follow-up.
Antigens Groups The CS protein only recorded difference in
Normal Low‑grade High‑grade High‑grade immunoreactivity between low- and high-grade tumors,
(n=10) pTa pTa pT1 but it did not show changes in protein levels between these
(%) (n=10) (%) (n=10) (%) (n=10) (%) groups. Interestingly, CS protein levels were significantly
β-F1-ATP 3 (92.7)* 3 (86.2)* 2 (41.3) 1 (15.1) higher in normal bladder tissue when compared to different
synthase NMIBC grades. It may have happened because this enzyme
HADHSC 3 (91.1)* 3 (90.5)* 2 (61.7) 1 (17.9) is directly linked to pathway speed, rather than to deviations
PDH 3 (83.0)* 3 (85.9)* 2 (51.1) 1 (19.3) in metabolic pathways. However, further studies focused
CS 3 (88.4)* 3 (94.8)* 2 (52.5) 1 (23.0) on investigating the actual role played by this enzyme in
GLUT1 1 (17.3) 1 (29.7) 3 (89.9)* 3 (79.7)* NMIBC metabolism should be conducted. 28
PFK 1 (24.9) 1 (32.0) 3 (94.2)* 3 (92.1)* Immunohistochemistry and Western blotting results
GAPDH 1 (19.8) 1 (29.3) 3 (85.2)* 3 (76.4)* observed for high-grade pTa and high-grade pT1 tumors
were quite consistent with each other, but they differed
LDH 1 (30.2) 1 (27.4) 3 (94.7)* 3 (88.2)*
from those observed for normal bladder tissue and low-
hsp60 3 (93.5)* 3 (89.2)* 3 (87.1)* 3 (81.9)*
grade pTa tumors. The high-grade pTa and high-grade pT1
Notes: 0, lack of immunoreactivity; 1, weak immunoreactivity (1 – 35% tumors manifested intense-to-moderate immunoreactivity
positive urothelial cells); 2, moderate immunoreactivity (36 – 70%
positive urothelial cells); 3, intense immunoreactivity (>70% positive for proteins associated with glycolytic pathway, as well as
urothelial cells). *Statistical significance (proportion test, P<0.0001). higher GLUT1, PFK, and GAPDH protein levels. They
Abbreviations: ATP: Adenosine triphosphate; GLUT1: Glucose also presented weak immunoreactivity and low β-F1-ATP
transporter-1; PFK: Phosphofructokinase; GAPDH: Glyceraldehyde synthase, HADHSC, and PDH protein levels. Thus, they
3-phosphate dehydrogenase; LDH: Lactate dehydrogenase; PDH: presented IBEC lower than that of normal bladder tissue
Pyruvate dehydrogenase; CS: Citrate synthase; HADHSC: Short chain
3-hydroxyacyl-CoA dehydrogenase; hsp60: Heat shock protein 60. and low-grade tumors.
Low IBEC in high-grade tumors highlights significant
protein levels, in association with weak immunoreactivity changes in the energy metabolism of normal cells. As
and reduced GAPDH protein levels. These tumors previously suggested by Otto Warburg, the energy metabolic
also presented intense immunoreactivity and high activity of malignant neoplasms is mostly concentrated
HADHSC and PDH protein levels, in addition to weak in the glycolytic pathway. Increased metabolism in
13
immunoreactivity and decreased GLUT1 and PFK protein tumor cells requires higher ATP consumption, and
levels. since the glycolytic pathway produces less ATP than
Increased β-F1-ATP synthase activity indicates oxidative phosphorylation, although much faster, some
increased mitochondrial activity, since this protein crosses enzymes present increased activity to promptly meet the
the mitochondrial inner membrane and accounts for ADP energy needs of these cells. GLUT1 belongs to the GLUT
conversion into ATP. This process takes place through molecules’ family and wields paramount importance in
ADP combination to a free ionic phosphate radical, which this scenario, since it accounts for allowing glucose to enter
adds another high energy phosphate bond to the molecule. the cells. The literature reported increased activity of this
The final process happens when ATP is transported by protein in a series of neoplasms, such as pancreatic, ovarian
29
facilitated mitochondria diffusion into the cytoplasm. and kidney cancer, among others. This glucose avidity
After the entire process, each glucose molecule generated can be measured through positron emission tomography-
38 ATPs, carbon dioxide, and water. 13-16 The HADHSC computed tomography, an examination tool used to
protein transforms fatty acid into acetyl-coA, and PDH assess the metabolism of structures based on radiotracer
transforms pyruvate into acetyl-coA, and both of them glucose uptake determined by F18-fluorordesoxyglucose
transform different substrates into acetyl-coA in order to radiopharmaceutical. Lesions presenting high radiotracer
generate energy in the mitochondria. These proteins are glucose uptake are metabolically active. Consequently,
30
closely related to oxidative phosphorylation, and this is they become more aggressive. The major BC indications
the typical, normal mode of cell metabolism, since it does comprise lymph node staging, distant metastasis and
30
not deviate from the metabolic pathway to generate other relapse after definitive treatment.
substrates, as well as because it happens in an environment Cancer cells present increased glucose and glutamine
presenting normal oxygen levels. Therefore, high IBEC uptake during cancer invasiveness progression, mostly by
13
Volume 3 Issue 1 (2024) 11 https://doi.org/10.36922/td.2290