
Page 43 - TD-3-1
P. 43
Tumor Discovery Energy metabolism in bladder cancer
A B C
D E F
G H I
J K L
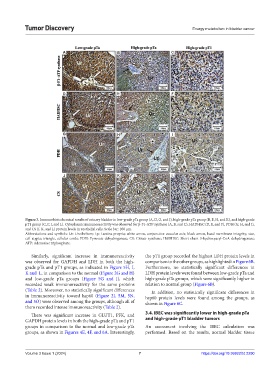
Figure 3. Immunohistochemical results of urinary bladder in low-grade pTa group (A, D, G, and J), high-grade pTa group (B, E, H, and K), and high-grade
pT1 group (C, F, I, and L). Cytoplasmic immunoreactivity was observed for β-F1-ATP synthase (A, B, and C), HADHSC (D, E, and F), PDH (G, H, and I),
and CS (J, K, and L) protein levels in urothelial cells. Scale bar: 100 µm.
Abbreviations and symbols: Ur: Urothelium; Lp: Lamina propria; white arrow, conjunctive-vascular axis; black arrow, basal membrane integrity; star,
cell atypia; triangle, cellular cords; PDH: Pyruvate dehydrogenase; CS: Citrate synthase; HADHSC: Short chain 3-hydroxyacyl-CoA dehydrogenase;
ATP: Adenosine triphosphate.
Similarly, significant increase in immunoreactivity the pT1 group recorded the highest LDH protein levels in
was observed for GAPDH and LDH in both the high- comparison to the other groups, as highlighted in Figure 6B.
grade pTa and pT1 groups, as indicated in Figure 5H, I, Furthermore, no statistically significant differences in
K and L, in comparison to the normal (Figure 2G and H) LDH protein levels were found between low-grade pTa and
and low-grade pTa groups (Figure 5G and J), which high-grade pTa groups, which were significantly higher in
recorded weak immunoreactivity for the same proteins relation to normal group (Figure 6B).
(Table 2). Moreover, no statistically significant differences In addition, no statistically significant differences in
in immunoreactivity toward hsp60 (Figure 2I, 5M, 5N, hsp60 protein levels were found among the groups, as
and 5O) were observed among the groups, although all of shown in Figure 6C.
them recorded intense immunoreactivity (Table 2).
There was significant increase in GLUT1, PFK, and 3.4. IBEC was significantly lower in high-grade pTa
GAPDH protein levels in both the high-grade pTa and pT1 and high-grade pT1 bladder tumors
groups in comparison to the normal and low-grade pTa An assessment involving the IBEC calculation was
groups, as shown in Figures 4E, 4F, and 6A. Interestingly, performed. Based on the results, normal bladder tissue
Volume 3 Issue 1 (2024) 7 https://doi.org/10.36922/td.2290