
Page 41 - TD-3-1
P. 41
Tumor Discovery Energy metabolism in bladder cancer
A B
C D
E F
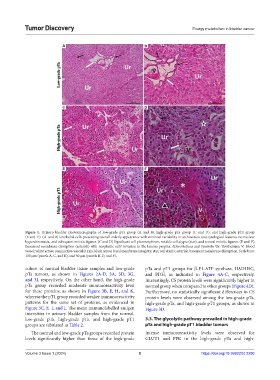
Figure 1. Urinary bladder photomicrographs of low-grade pTa group (A and B), high-grade pTa group (C and D), and high-grade pT1 group
(E and F). (A and B) Urothelial cells presenting overall orderly appearance with minimal variability in architecture and cytological features, no nuclear
hyperchromasia, and infrequent mitotic figures. (C and D) Significant cell pleomorphism, notable cell atypia (star), and several mitotic figures. (E and F)
Basement membrane disruption (asterisk) with neoplastic cells’ invasion in the lamina propria. Abbreviations and symbols: Ur: Urothelium; V: Blood
vessel; white arrow, conjunctive-vascular axis; black arrow, basal membrane integrity; star, cell atypia; asterisk, basement membrane disruption. Scale bars:
100 μm (panels A, C, and E), and 50 μm (panels B, D, and F).
cohort of normal bladder tissue samples and low-grade pTa and pT1 groups for β-F1-ATP synthase, HADHSC,
pTa tumors, as shown in Figures 2A-D, 3A, 3D, 3G, and PDH, as indicated in Figure 4A-C, respectively.
and 3J, respectively. On the other hand, the high-grade Interestingly, CS protein levels were significantly higher in
pTa group recorded moderate immunoreactivity level normal group when compared to other groups (Figure 4D).
for these proteins, as shown in Figure 3B, E, H, and K, Furthermore, no statistically significant differences in CS
whereas the pT1 group recorded weaker immunoreactivity protein levels were observed among the low-grade pTa,
patterns for the same set of proteins, as evidenced in high-grade pTa, and high-grade pT1 groups, as shown in
Figure 3C, F, I, and L. The mean immunolabelled antigen Figure 3D.
intensities in urinary bladder samples from the normal,
low-grade pTa, high-grade pTa, and high-grade pT1 3.3. The glycolytic pathway prevailed in high-grade
groups are tabulated in Table 2. pTa and high-grade pT1 bladder tumors
The normal and low-grade pTa groups recorded protein Intense immunoreactivity levels were observed for
levels significantly higher than those of the high-grade GLUT1 and PFK in the high-grade pTa and high-
Volume 3 Issue 1 (2024) 5 https://doi.org/10.36922/td.2290