
Page 107 - TD-3-4
P. 107
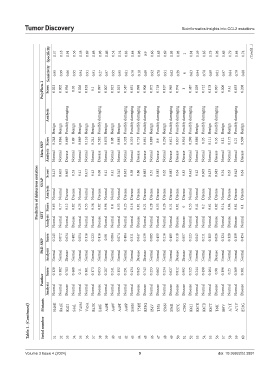
Tumor Discovery                                                   Bioinformatics insights into CCL2 mutations


                      Specificity  0.57  0.18  0.91  0.56  0.58  0.69  0.68  0.98  0.46  0.54  0.54  0.83  0.84  0.98  0.9  0.66  0.85  0.69  0.93  0.93  1  0.81  0.59  0.85  0.73  0.93  0.45  0.79  0.84  0.74  (Cont’d...)


                      Sensitivity  0.95  0.99  0.66  0.95  0.94  0.91  0.91  0.27  0.97  0.95  0.95  0.81  0.79  0.18  0.69  0.92  0.78  0.91  0.62  0.59  0  0.83  0.94  0.78  0.89  0.61  0.97  0.84  0.79  0.88


                   PolyPhen-2  Score  0.023  0.002  0.936  0.02  0.026  0.103  0.1  0.997  0.007  0.015  0.015  0.587  0.651  0.998  0.906  0.075  0.718  0.107  0.965  0.976  1  0.487  0.029  0.712  0.178  0.967  0.006  0.41  0.653  0.208


                      Analysis  Possibly damaging  Possibly damaging  Possibly damaging  Possibly damaging  Possibly damaging  Possibly damaging  Possibly damaging  Possibly damaging  Possibly damaging  Possibly damaging  Possibly damaging  Possibly damaging  Possibly damaging  Possibly damaging


                        Benign  Benign  Benign  Benign  Benign  Benign  Benign  Benign  Benign  Benign  Benign  Benign  Benign  Benign  Benign  Benign


                   Meta-SNP  Score  Analysis  0.248  Normal  0.084  Normal  0.669  Disease  0.49  Normal  0.069  Normal  0.116  Normal  0.241  Normal  0.582  Disease  0.076  Normal  0.08  Normal  0.085  Normal  0.328  Normal  0.325  Normal  0.733  Disease  0.661  Disease  0.089  Normal  0.6  Disease  0.236  Normal  0.612  Disease  0.637  Disease  0.916  Disease  0.296  Normal  0.086  Normal  0.26  Normal  0.111  Normal  0.56  Disease  0.12  Normal  0.175  Normal  0.21  No


                 Prediction of deleterious mutation  SNAP  Score  Analysis  0.415  Normal  0.65  0.405  Normal  0.77  0.665  Disease  0.12  0.53  Disease  0.02  0.41  Normal  0.25  0.475  Normal  0.53  0.43  Normal  0.36  0.68  Disease  0.02  0.41  Normal  0.96  0.41  Normal  0.4  0.345  Normal  0.53  0.635  Disease  0.23  0.58  Disease  0.16  0.86  Disease  0.01  0.685  Disease  0.21  0.51  Disease  0.28  0.585  Disease  0.53  0.62  Disease  0.26  0.685  Disease  0.31  0


                      Analysis SIFT   Score  Normal  Normal  Normal  Disease  Normal  Normal  Normal  Disease  Normal  Normal  Normal  Normal  Normal  Disease  Normal  Normal  Normal  Normal  Normal  Disease  Disease  Normal  Normal  Normal  Normal  Disease  Normal  Disease  Disease  Normal


                   PhD-SNP   Score  0.245  0.072  0.634  0.482  0.054  0.116  0.223  0.416  0.08  0.084  0.074  0.404  0.311  0.647  0.539  0.085  0.455  0.216  0.485  0.518  0.857  0.223  0.043  0.211  0.105  0.626  0.124  0.128  0.159  0.454

                      Analysis  Normal  Normal  Disease  Normal  Normal  Normal  Normal  Normal  Normal  Normal  Normal  Normal  Normal  Disease  Disease  Normal  Normal  Normal  Normal  Disease  Disease  Normal  Normal  Normal  Normal  Disease  Normal  Normal  Normal  Normal


                      Score  0.128  0.182  0.703  0.468  0.11  0.161  0.173  0.653  0.207  0.241  0.152  0.291  0.434  0.845  0.743  0.253  0.662  0.234  0.627  0.812  0.992  0.525  0.244  0.498  0.464  0.98  0.196  0.25  0.369  0.581
                   Panther
                      Analysis  Normal  Normal  Disease  Normal  Normal  Normal  Normal  Disease  Normal  Normal  Normal  Normal  Normal  Disease  Disease  Normal  Disease  Normal  Disease  Disease  Disease  Disease  Normal  Normal  Normal  Disease  Normal  Normal  Normal  Disease


             Table 1. (Continued)  Mutants Serial number  N40K  R41K  K42I  S44L  V45M  V45A  R47K  L48F  A49E  A49V  A49T  A49P  S50N  Y51H  R53G  I54V  T55S  S56N  S56R  S57C  C59G  K61I  K67R  K67D  K67T  T68I  I69V  A71T  A71V  E73G


                                                                                                   58
                                                                                                      59
                                                                                                         60
                                                                                                 57
                         31
                            32
            Volume 3 Issue 4 (2024)   33  34  35  36  37  38  39  40  41  42  43  9 44  45  46  47  48  49  50  51  52  53  54  55  56  doi: 10.36922/td.3891