
Page 129 - TD-3-4
P. 129
Tumor Discovery CTC characterization for EGFR mutations
fwd-GCTGGTAACATCCACCCAGA rev-TTATCTC able to capture EpCAM-positive cells (Figure 2). Having
CCCTCCCCGTATC (261 bp); exon 20: fwd-CACA CT established the optimal parameters for collection, the
GACGTGCCTCTCC rev-TTATCTCCCCTCCCCGTA CTCs from PC-9 were analyzed for mutations in 4 exons of
TC (251 bp); exon 21: fwd-AGCCATAAGTCCTCG the EGFR gene. Figure 3A shows the gene amplification of
ACGTG rev-CCTGGTGTCAGGAAAATGCT (320 bp) each exon independently using gDNA obtained from the
(primer sequences were obtained from Stab Vida Genetics PC-9 cell line, showing that all mutations were detectable.
Laboratory, Portugal). Genomic DNA (3 µL) was added to Figure 3B shows a multiplex PCR using the same primers
47 µL of standard PCR mix (provided by Stab Vida Genetics on cells isolated from experiments where the PC-9 cells
6
Laboratory, Portugal) Thermocycling temperatures were as were spiked into media at various concentrations (1 × 10 ,
.
5
4
3
follows: initial denaturing at 98 °C for 15 min, then 40 cycles 2 × 10 , 4 × 10 , and 8 × 10 cells/mL).
of denaturation at 94 °C for 30 s, annealing at 58 °C for 1 min, 3.2. Isolation of EpCAM-positive cells from the blood
and amplification at 75 °C for 1 min, with a final elongation of patients with NSCLC
step at 70 °C for 5 min. PCR products were evaluated using gel
electrophoresis on 2% (w/v) agarose gel. CTCs isolated from the blood of patients were
immunostained to identify markers of epithelial cells and
2.11. Next-generation sequencing (NGS) to ensure that the cells isolated were tumor-derived. Figure 4A
determine exon 18 – 21 mutations in patient shows a brightfield image of a clump of cells and beads
samples isolated from the patient’s blood. Figure 4B shows that
Amplicon and library generation were performed according the isolated cells were tumor-derived as the clump stained
to the procedure of Nextera XT (15031942) (Illumina, well with a pan-cytokeratin antibody (which stains for
USA). The amplicon generated was sequenced using an epithelial-derived cells). Figure 4C shows that only a few
Illumina sequencer, with the data being processed using cells stained positive for CD45 antigen using rhodamine-
Trim galore (version 0.4.3.1) and Prinseq (version 0.20.4). conjugated mouse anti-human CD45 antibodies (a marker
After sorting, data were aligned to the reference with BWA for hematological cells), most possibly showing a few
(MEM) version 0.7.17.1. Variants were detected using the leukocytes co-isolated with the tumor cells. Figure 4D
VAR direct version from 07.03.2018 (sequencing was done shows that most of the cells stained positive for DNA
at Stab Vida Genetics Laboratory, Portugal). content using DAPI. Figure 4E presents a merged image
of the three fluorescence channels, clearly showing that the
2.12. Statistical analysis epithelial tumor cells are the predominant cell type isolated.
Data were analyzed using Prism version 9.0 (Graph pad 3.3. Patient characteristics
software, San Diego California USA).
Fifty-nine patients recruited for the study were diagnosed
3. Results following a tissue biopsy. Their clinicopathological
characteristics are shown in Table 1, and the process of
3.1. Device description and validation recruitment is described in Figure 5.
The device was designed to isolate EpCAM-positive
cells in blood contained within a PMMA device using a
4.5-µm diameter magnetic bead covalently bound to an
anti-EpCAM antibody sweeping through the blood on
a chip (Figure 1). As the magnetic bead sweeps through
the blood, it binds with any EpCAM-positive cells. The
movement of the magnetic beads can be attributed to the
magnetic field generated by NdFeBr magnets attached
to the electromagnetic arms of the unit. The arm moves
across the chip in step delays of 6 s to allow sufficient
time for all magnetized cells to be dragged through the
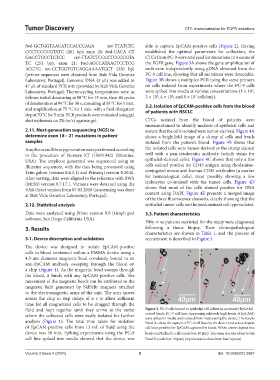
fluid and kept together until they arrive at the outlet Figure 2. PC-9 cells bound to epithelial cell adhesion molecule (EpCAM)-
where the collected cells were easily isolated for further coated beads. PC-9 cell lines (expressing relatively high levels of EpCAM)
were spiked in media and isolated from media using the device. The results
analysis (Figure 1). The total time taken for isolation Panel A- show the capture of PC-9 cell lines by the device (red arrow depicts
of EpCAM-positive cells from 13 mL of fluid using the cell lines positive for EpCAM captured by beads. White arrow depicts free
device was 50 min. Spiking experiments using the PC-9 beads unattached to cells (scale bar: 40 µm). The same was also observed in
cell line spiked into media showed that the device was Panel B (scale bar: 40 µm) (representative data from four repeats)
Volume 3 Issue 4 (2024) 5 doi: 10.36922/td.3987