
Page 130 - TD-3-4
P. 130
Tumor Discovery CTC characterization for EGFR mutations
A B
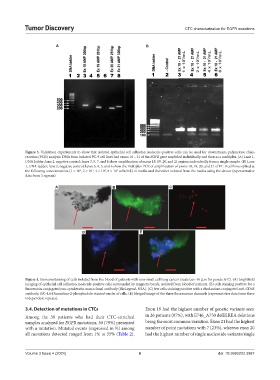
Figure 3. Validation experiments to show that isolated epithelial cell adhesion molecule-positive cells can be used for downstream polymerase chain
reaction (PCR) analysis. DNA from isolated PC-9 cell lines had exons 18 – 21 of the EGFR gene amplified individually and then as a multiplex. (A) Lane 1,
DNA ladder; lane 2, negative control; lanes 3, 5, 7, and 8 show amplification of exons 18, 19, 20, and 21 regions individually from a single sample. (B) Lane
1, DNA ladder; lane 2, negative control; lanes 3, 4, 5, and 6 show the multiplex PCR of amplification of exons 18, 19, 20, and 21 of PC-9 cell lines spiked at
5
6
the following concentrations (1 × 10 , 2 × 10 , 4 × 10 , 8 × 10 cells/mL) in media and thereafter isolated from the media using the device (representative
4
3
data from 3 repeats).
A B C
D E
Figure 4. Immunostaining of cells isolated from the blood of patients with non-small cell lung cancer (scale bar: 40 µm for panels A-E). (A) brightfield
imaging of epithelial cell adhesion molecule-positive cells surrounded by magnetic beads, isolated from blood of patients. (B) cells staining positive for a
fluorescein-conjugated pan-cytokeratin monoclonal antibody (BioLegend, USA). (C) few cells staining positive with a rhodamine-conjugated anti-CD45
antibody. (D) 4,6-Diamidino-2-phenylindole-stained-nuclei of cells. (E) Merged image of the three fluorescence channels (representative data from three
independent repeats).
3.4. Detection of mutations in CTCs Exon 19 had the highest number of genetic variants seen
Among the 38 patients who had their CTC-enriched in 26 patients (87%), with E746_A750 delELREA deletions
samples analyzed for EGFR mutations, 30 (79%) presented being the most common variation. Exon 21 had the highest
with a mutation. Mutated events (expressed in %) among number of point mutations with 7 (23%), whereas exon 20
all mutations detected ranged from 1% to 55% (Table 2). had the highest number of single nucleotide variants/single
Volume 3 Issue 4 (2024) 6 doi: 10.36922/td.3987