
Page 93 - TD-4-2
P. 93
Tumor Discovery SNPs rs9929218 and rs6983267 in Kurdish CRC
Table 2. Primer sequences for wild‑type and mutant alleles of the two SNPs
SNPs Primers (5’ to 3’) Target Location on chromosomes
rs9929218 GTTGTACAGTCATCTGCAAGCACATGTG Outer forward Chr16: 68786794
ATTCAAAGGTTCTGAATTCCACACCG Wild-type (G) Chr16: 68787018
ATTCAAAGGTTCTGAATTCCACACCA Mutant (A) Chr16: 68787018
GGGAGAGAAATTCCAGGGGTAGTTAACA Outer reverse Chr16: 68787220
rs6983267 ATTAGAAAACCTGATTTCCCTTCCAGCT Outer forward Chr8: 127400871
GTCCTTTGAGCTCAGCAGATGAAGGG Wild-type (G) Chr8: 127401035
GTCCTTTGAGCTCAGCAGATGAAGGT Mutant (T) Chr8: 127401035
TGTCTGTATACACAGCCCAGTCTAAGGC Outer Reverse Chr8: 127401225
Abbreviation: SNP: Single-nucleotide polymorphism.
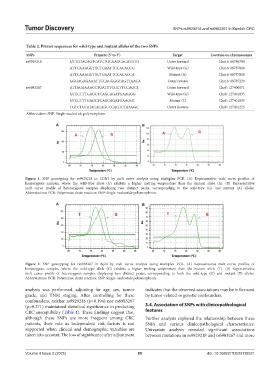
A B
Figure 1. SNP genotyping for rs9929218 in CDH1 by melt curve analysis using multiplex PCR. (A) Representative melt curve profiles of
homozygous samples, where the wild-type allele (G) exhibits a higher melting temperature than the mutant allele (A). (B) Representative
melt curve profile of heterozygous samples displaying two distinct peaks, corresponding to the wild-type (G) and mutant (A) alleles.
Abbreviations: PCR: Polymerase chain reaction; SNP: Single-nucleotide polymorphism.
A B
Figure 2. SNP genotyping for rs6983267 in 8q24 by melt curve analysis using multiplex PCR. (A) Representative melt curve profiles of
homozygous samples, where the wild-type allele (G) exhibits a higher melting temperature than the mutant allele (T). (B) Representative
melt curve profile of heterozygous samples displaying two distinct peaks, corresponding to both the wild-type (G) and mutant (T) alleles.
Abbreviations: PCR: Polymerase chain reaction; SNP: Single-nucleotide polymorphism.
analysis was performed, adjusting for age, sex, tumor indicates that the observed associations may be influenced
grade, and TNM staging. After controlling for these by tumor-related or genetic confounders.
confounders, neither rs9929218 (p=0.194) nor rs6983267
(p=0.271) maintained statistical significance in predicting 3.4. Association of SNPs with clinicopathological
CRC susceptibility (Table 4). These findings suggest that, features
although these SNPs are more frequent among CRC Further analysis explored the relationship between these
patients, their role as independent risk factors is not SNPs and various clinicopathological characteristics.
supported when clinical and demographic variables are Univariate analysis revealed significant associations
taken into account. The loss of significance after adjustment between mutations in rs9929218 and rs6983267 and more
Volume 4 Issue 2 (2025) 85 doi: 10.36922/TD025110021