
Page 75 - AIH-1-3
P. 75
Artificial Intelligence in Health Rotational thermography for breast cancer screening
2.3. IR-image feature-based analysis technique Subsequently, another dataset was acquired in the lower
In PS1 and PS2, the IR images were analyzed conventionally, ambient temperature state. The differences between the two
following the method adopted in previous studies. The datasets were the key discriminating features for analysis.
features extracted were the mean, median, mode, standard This novel analysis technique was tested on 88 subjects
deviation, histogram, and maximum value. Analysis from a hospital in northeast India. Figure 6 displays the
was conducted in consultation with doctors, but no frontal view of the IR images of a subject’s affected and
reference was made to IR images acquired through USG, normal breasts, highlighted by the red and blue zones,
mammography, or biopsy. respectively.
In PS3, the primary reference source was the USG 2.3.1. Temperature area clustering method
and biopsy reports obtained through other modalities. IR The number of pixels corresponding to each temperature
image-based clustering was used for image segmentation cluster zone was recorded during IR image analysis. The
and to extract the ROI. total number of pixels represented the area of each zone.
The mean temperature of each ROI, interpreted For example, the camera used in this study captures a 640
as different body temperature zones, was used as the × 480–pixel IR image, which is considered to be 100%
discriminating feature. IR image K-means clustering area. Accordingly, if a particular zone had 7962 pixels, it
was used for clustering the other image features. 12,25,28 spread over 2.59% of the IR image and was known as a
The clustering method was gradually improved, and the percent area cluster. The distributions of these area zones
number of clusters was optimized from 20 to seven based across different temperatures are depicted in Figure 7
on experimental validation by consulting doctors based on using bar plots. Higher temperature regions indicative of
abnormalities found in the USG and biopsy reports. This abnormalities are conventionally represented in specific
study extracted temperature-based clustering features for colors. The color scale in the figure does not mark the
IR image segmentation for 33 subjects. In the next stage of seven cluster zones described in this paper. Instead, it
8
development (FS), the image background and foreground only demonstrates the color temperature relative to the IR
were separated through FCM clustering. Figure 5 shows image, while the clusters are outlined plots overlayed on
7
the variation in the IR breast images captured from different the IR image.
angles, with the abnormality detected by the software and Figure 7 illustrates the real-world implications of the
doctors as irregular and box-shaped ROI, respectively. temperature zone versus percent area cluster analysis.
Final IR image analysis was accomplished after For the patient in question, imaging at a higher ambient
integrating the temperature-controlled enclosure into temperature revealed that the right breast had 14.91% of its
the system. The higher ambient temperature state was area at 34.59°C (zone 0). When the ambient temperature
chosen as the reference temperature. The ROI was divided was lowered, the area of the right breast at 34.43°C increased
into seven clusters through K-median clustering and was to 15.89% (zone 0). Since the highest body temperature
defined as the features in the machine learning algorithm did not decrease with a change in ambient temperature,
for processing. Seven clusters were finalized based on we concluded that the right breast had an abnormality.
experimental validation of the abnormality found in Conversely, for the left breast, the highest temperature at a
the USG and biopsy reports by the consulting doctors. higher ambient temperature was 33.50°C, covering 0.59%
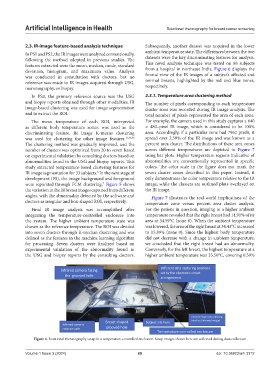
Figure 4. Rotational thermography setup in a temperature-controlled enclosure. Setup images shown here are collected during data collection
Volume 1 Issue 3 (2024) 69 doi: 10.36922/aih.3312