
Page 78 - AIH-1-3
P. 78
Artificial Intelligence in Health Rotational thermography for breast cancer screening
different angles of the breast, dynamic IR image collection across various breast cancer scenarios. Table 3 displays the
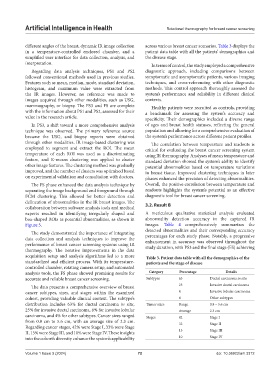
in a temperature-controlled enclosed chamber, and a patient data table with all the patients’ demographics and
simplified user interface for data collection, analysis, and the disease stage.
interpretation. In terms of control, the study employed a comprehensive
Regarding data analysis techniques, PS1 and PS2 diagnostic approach, including comparisons between
followed conventional methods used in previous studies. symptomatic and asymptomatic patients, various imaging
Features such as mean, median, mode, standard deviation, techniques, and cross-referencing with other diagnostic
histogram, and maximum value were extracted from methods. This control approach thoroughly assessed the
the IR images. However, no reference was made to system’s performance and reliability in different clinical
images acquired through other modalities, such as USG, contexts.
mammography, or biopsy. The PS3 and FS are complete Healthy patients were recruited as controls, providing
with the information about PS1 and PS2, assessed for their a benchmark for assessing the system’s accuracy and
value in the research article. specificity. Their demographics included a diverse range
In PS3, a shift toward a more comprehensive analysis of ages and breast health statuses, reflecting the general
technique was observed. The primary reference source population and allowing for a comprehensive evaluation of
became the USG, and biopsy reports were obtained the system’s performance across different patient profiles.
through other modalities. IR image-based clustering was The correlation between temperature and readouts is
employed to segment and extract the ROI. The mean critical for evaluating the breast cancer screening system
temperature of each ROI was used as a discriminating using IR thermography. Analyses of mean temperature and
feature, and K-means clustering was applied to cluster standard deviation showed the system’s ability to identify
other image features. The clustering method was gradually potential abnormalities based on temperature variations
improved, and the number of clusters was optimized based in breast tissue. Improved clustering techniques in later
on experimental validation and consultation with doctors. phases enhanced the precision of detecting abnormalities.
The FS phase enhanced the data analysis technique by Overall, the positive correlation between temperature and
separating the image background and foreground through readouts highlights the system’s potential as an effective
FCM clustering. This allowed for better detection and diagnostic tool for breast cancer screening.
delineation of abnormalities in the IR breast images. The 3.2. Result B
collaboration between software analysis tools and medical
experts resulted in identifying irregularly shaped and A meticulous qualitative statistical analysis evaluated
box-shaped ROIs as potential abnormalities, as shown in abnormality detection accuracy in the captured IR
Figure 5. images. Table 4 comprehensively summarizes the
detected abnormalities and their corresponding accuracy
The study demonstrated the importance of integrating
data collection and analysis techniques to improve the percentages for each study phase. Notably, a progressive
enhancement in accuracy was observed throughout the
performance of breast cancer screening systems using IR study duration, with PS3 and the final stage (FS) achieving
thermography. The iterative improvements in the data
acquisition setup and analysis algorithms led to a more Table 3. Patient data table with all the demographics of the
standardized and efficient process. With its temperature- patients and the stage of disease
controlled chamber, rotating camera setup, and automated
analysis tools, the FS phase showed promising results for Category Percentage Details
accurate and reliable breast cancer screening. Subtypes 63 Ductal carcinoma in situ
The data presents a comprehensive overview of breast 25 Invasive ductal carcinoma
cancer subtypes, sizes, and stages within the examined 8 Invasive lobular carcinoma
cohort, providing valuable clinical context. The subtype’s 4 Other subtypes
distribution includes 63% for ductal carcinoma in situ, Tumor sizes Range 0.8 – 5.6 cm
25% for invasive ductal carcinoma, 8% for invasive lobular Average 2.3 cm
carcinoma, and 4% for other subtypes. Cancer sizes ranged Stages 42 Stage I
from 0.8 cm to 5.6 cm, with an average size of 2.3 cm. 33 Stage II
Regarding cancer stages, 42% were Stage I, 33% were Stage
II, 15% were Stage III, and 10% were Stage IV. These insights 15 Stage III
into the cohort’s diversity enhance the system’s applicability 10 Stage IV
Volume 1 Issue 3 (2024) 72 doi: 10.36922/aih.3312