
Page 76 - AIH-1-3
P. 76
Artificial Intelligence in Health Rotational thermography for breast cancer screening
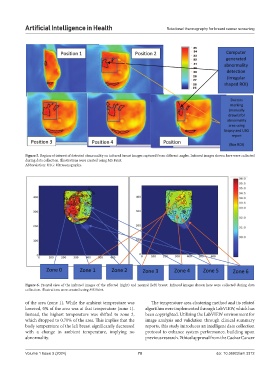
Figure 5. Region of interest of detected abnormality on infrared breast images captured from different angles. Infrared images shown here were collected
during data collection. Illustrations were created using MS Paint.
Abbreviation: USG: Ultrasonography.
Figure 6. Frontal view of the infrared images of the affected (right) and normal (left) breast. Infrared images shown here were collected during data
collection. Illustrations were created using MS Paint.
of the area (zone 1). While the ambient temperature was The temperature area clustering method and its related
lowered, 0% of the area was at that temperature (zone 1). algorithm were implemented through LabVIEW, which has
Instead, the highest temperature was shifted to zone 2, been copyrighted. Utilizing the LabVIEW environment for
which dropped to 0.70% of the area. This implies that the image analysis and validation through clinical summary
body temperature of the left breast significantly decreased reports, this study introduces an intelligent data collection
with a change in ambient temperature, implying no protocol to enhance system performance, building upon
abnormality. previous research. Ethical approval from the Cachar Cancer
Volume 1 Issue 3 (2024) 70 doi: 10.36922/aih.3312