
Page 79 - AIH-1-3
P. 79
Artificial Intelligence in Health Rotational thermography for breast cancer screening
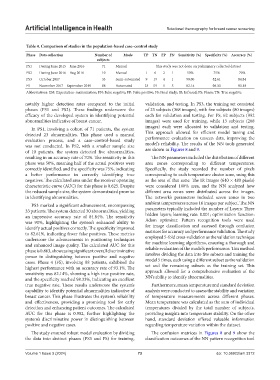
Table 4. Comparison of studies in the population‑based case–control study
Phase Data collection Number of Mode TP TN FP FN Sensitivity (%) Specificity (%) Accuracy (%)
subjects
PS1 During June 2015 – June 2016 71 Manual This study was not done on preliminary collected dataset
PS2 During June 2016 – Aug 2016 10 Manual 1 6 2 1 50% 75% 70%
PS3 October 2017 33 Semi-automated 9 19 4 1 90.00 82.61 84.84
FS November 2017 – September 2019 88 Automated 23 59 1 5 82.14 98.33 93.18
Abbreviations: EM: Expectation-maximization; FN: False negative; FP: False positive; FS: Final study; IR: Infrared; PS: Phase; TN: True negative.
notably higher detection rates compared to the initial validation, and testing. In PS3, the training set consisted
phases (PS1 and PS2). These findings underscore the of 23 subjects (368 images), with five subjects (80 images)
efficacy of the developed system in identifying potential each for validation and testing. For FS, 62 subjects (992
abnormalities indicative of breast cancer. images) were used for training, while 13 subjects (208
In PS1, involving a cohort of 71 patients, the system images) each were allocated to validation and testing.
detected 23 abnormalities. This phase used a manual This approach allowed for efficient model tuning and
evaluation process, and a case–control-based study performance evaluation on unseen data, improving the
was not conducted. In PS2, with a smaller sample size model’s reliability. The results of the NN tools generated
of 10 patients, the system detected five abnormalities, are shown in Figures 8 and 9.
resulting in an accuracy rate of 70%. The sensitivity in this The NN parameters included the distribution of different
phase was 50%, meaning half of the actual positives were area zones corresponding to different temperatures.
correctly identified, and the specificity was 75%, indicating Specifically, the study recorded the number of pixels
a better performance in correctly identifying true corresponding to each temperature cluster zone, using this
negatives. The calculated area under the receiver operating as the area of that zone. The IR images (640 × 480 pixels)
characteristic curve (AUC) for this phase is 0.625. Despite were considered 100% area, and the NN analyzed how
the reduced sample size, the system demonstrated promise different area zones were distributed across the images.
in identifying abnormalities. The network’s parameters included seven zones in two
PS3 marked a significant advancement, encompassing ambient temperatures across 16 images per subject. The NN
33 patients. The system detected 30 abnormalities, yielding parameters typically included the number of Layers: Three
an impressive accuracy rate of 84.84%. The sensitivity hidden layers; learning rate: 0.001; optimization function:
was 90%, highlighting the system’s enhanced ability to Adam optimizer. Pattern recognition tools were used
identify actual positives correctly. The specificity improved for image classification and assessed through confusion
to 82.61%, indicating fewer false positives. These metrics matrices for accuracy and performance validation. The study
underscore the advancements in positioning techniques employed 5-fold cross-validation as the validation technique
and enhanced image quality. The calculated AUC for this for machine learning algorithms, ensuring a thorough and
phase is 0.863, showcasing significant overall discriminative reliable evaluation of the model’s performance. This method
power in distinguishing between positive and negative involves dividing the data into five subsets and training the
cases. Phase 4 (FS), involving 88 patients, exhibited the model 5 times, each using a different subset as the validation
highest performance with an accuracy rate of 93.1%. The set and the remaining subsets as the training set. This
sensitivity was 82.14%, showing a high true positive rate, approach allowed for a comprehensive evaluation of the
and the specificity reached 98.33%, indicating an excellent NN’s ability to identify abnormalities.
true negative rate. These results underscore the system’s Furthermore, mean temperature and standard deviation
capability to identify potential abnormalities indicative of analysis were conducted to assess the stability and variation
breast cancer. This phase illustrates the system’s reliability of temperature measurements across different phases.
and effectiveness, providing a promising tool for early Mean temperature was calculated as the sum of individual
detection and enhancing patient outcomes. The calculated temperatures divided by the total number of subjects,
AUC for this phase is 0.902, further highlighting the providing insights into temperature stability. On the other
system’s discriminative power in distinguishing between hand, standard deviation offered valuable information
positive and negative cases. regarding temperature variation within the dataset.
The study ensured robust model evaluation by dividing The confusion matrices in Figures 8 and 9 show the
the data into distinct phases (PS3 and FS) for training, classification outcomes of the NN pattern recognition tool
Volume 1 Issue 3 (2024) 73 doi: 10.36922/aih.3312