
Page 53 - AIH-1-4
P. 53
Artificial Intelligence in Health A fuzzy system for heartbeat classification
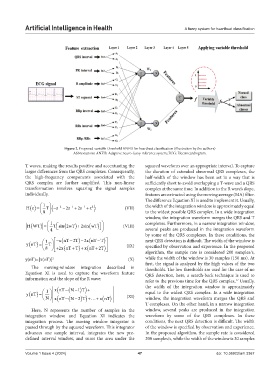
Figure 2. Proposed variable-threshold ANFIS for heartbeat classification (illustration by the authors)
Abbreviations: ANFIS: Adaptive neuro-fuzzy inference system; ECG: Electrocardiogram.
T waves, making the results positive and accentuating the squared waveform over an appropriate interval. To capture
larger differences from the QRS complexes. Consequently, the duration of extended abnormal QRS complexes, the
the high-frequency components associated with the half-width of the window has been set in a way that is
QRS complex are further amplified. This non-linear sufficiently short to avoid overlapping a T-wave and a QRS
transformation involves squaring the signal samples complex at the same time. In addition to the R wave’s slope,
individually. features are extracted using the moving average (MA) filter.
The difference Equation XI is used to implement it. Usually,
1 the width of the integration window is approximately equal
(
−1
Hz () = T − z −2 z + 2 z + ) (VII)
2
−1
−2
z
8 to the widest possible QRS complex. In a wide integration
window, the integration waveform merges the QRS and T
(
HWT) = 1 Tsin (2 wT) + 2sin ( wT) (VIII) complexes. Furthermore, in a narrow integration window,
4 several peaks are produced in the integration waveform
by some of the QRS complexes. In these conditions, the
− (
T) − (
−
(
ynT) = 1 T xnT −2 2 xnTT) (IX) next QRS detection is difficult. The width of the window is
xnTT) + (
specified by observation and experience. In the proposed
8 + ( + xnT + 2 T) algorithm, the sample rate is considered 200 samples/s,
2
y(nT)=[x(nT)] 2 (X) while the width of the window is 30 samples (150 ms). At
first, the signal is analyzed by the high values of the two
The moving-window integration described in thresholds. The low thresholds are used for the case of no
Equation XI is used to capture the waveform feature QRS detection, here, a search-back technique is used to
information and the slope of the R wave: refer to the previous time for the QRS complex. Usually,
27
xnT −(
equal to the widest QRS complex. In a wide integration
(
ynT) = 1 ( N − ) 1 T) + the width of the integration window is approximately
x nT)
xnT −(
N ( N − ) 2 T) +…+ ( (XI) window, the integration waveform merges the QRS and
T complexes. On the other hand, in a narrow integration
Here, N represents the number of samples in the window, several peaks are produced in the integration
integration window, and Equation XI indicates the waveform by some of the QRS complexes. In these
integration process. The moving window integrator is conditions, the next QRS detection is difficult. The width
passed through by the squared waveform. This integrator of the window is specified by observation and experience.
advances one sample interval, integrates the new pre- In the proposed algorithm, the sample rate is considered
defined interval window, and sums the area under the 200 samples/s, while the width of the window is 30 samples
Volume 1 Issue 4 (2024) 47 doi: 10.36922/aih.3367