
Page 69 - AIH-2-4
P. 69
Artificial Intelligence in Health Synthetic data for obesity level prediction
and calorie tracking, “no” responses were encoded as 0 transportation” was assigned the base value 0, whereas in
and “yes” responses as 1. the other version, “walking” was assigned 0. The results of
Label encoding was applied to attributes that exhibit an ML models showed no significant difference between these
ordinal relationship among their values. These attributes two approaches. As a result, the final version of the dataset
include frequency of vegetable consumption, food adopted the encoding that prioritized “walking,” with
consumption between meals, daily water consumption, values ranging from 0 to 4. The obesity level, designated as
frequency of physical activity, duration of technological the class label, was encoded from 0 to 3, where 0 represents
device use, alcohol consumption, transportation the lowest level (underweight), and 3 represents the highest
preference, and obesity level (class label). level (obese).
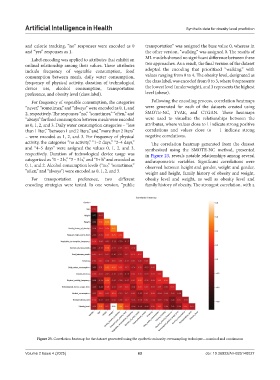
For frequency of vegetable consumption, the categories Following the encoding process, correlation heatmaps
“never,” “sometimes,” and “always” were encoded as 0, 1, and were generated for each of the datasets created using
2, respectively. The responses “no,” “sometimes,” “often,” and SMOTE-NC, TVAE, and CTGAN. These heatmaps
“always” for food consumption between meals were encoded were used to visualize the relationships between the
as 0, 1, 2, and 3. Daily water consumption categories – “less attributes, where values close to 1 indicate strong positive
than 1 liter,” “between 1 and 2 liters,” and “more than 2 liters” correlations and values close to − 1 indicate strong
– were encoded as 1, 2, and 3. For frequency of physical negative correlations.
activity, the categories “no activity,” “1–2 days,” “2–4 days,” The correlation heatmap generated from the dataset
and “4–5 days” were assigned the values 0, 1, 2, and 3, synthesized using the SMOTE-NC method, presented
respectively. Duration of technological device usage was in Figure 23, reveals notable relationships among several
categorized as “0 – 2 h,” “3 – 5 h,” and “5+ h” and encoded as anthropometric variables. Significant correlations were
0, 1, and 2. Alcohol consumption levels (“no,” “sometimes,” observed between height and gender, weight and gender,
“often,” and “always”) were encoded as 0, 1, 2, and 3. weight and height, family history of obesity and weight,
For transportation preference, two different obesity level and weight, as well as obesity level and
encoding strategies were tested. In one version, “public family history of obesity. The strongest correlation, with a
Figure 23. Correlation heatmap for the dataset generated using the synthetic minority oversampling technique—nominal and continuous
Volume 2 Issue 4 (2025) 63 doi: 10.36922/AIH025140027