
Page 73 - AIH-2-4
P. 73
Artificial Intelligence in Health Synthetic data for obesity level prediction
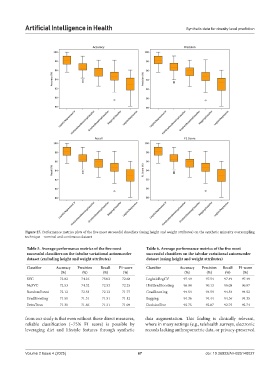
Figure 27. Performance metrics plots of the five most successful classifiers (using height and weight attributes) on the synthetic minority oversampling
technique—nominal and continuous dataset
Table 5. Average performance metrics of the five most Table 6. Average performance metrics of the five most
successful classifiers on the tabular variational autoencoder successful classifiers on the tabular variational autoencoder
dataset (excluding height and weight attributes) dataset (using height and weight attributes)
Classifier Accuracy Precision Recall F1‑score Classifier Accuracy Precision Recall F1‑score
(%) (%) (%) (%) (%) (%) (%) (%)
SVC 73.02 74.16 73.02 72.68 LogisticRegCV 97.49 97.54 97.49 97.49
NuSVC 72.53 74.32 72.53 72.25 HistGradBoosting 96.08 96.13 96.08 96.07
RandomForest 72.12 72.53 72.12 71.77 GradBoosting 94.54 94.59 94.54 94.52
GradBoosting 71.51 71.31 71.51 71.12 Bagging 94.36 94.44 94.36 94.35
ExtraTrees 71.31 71.66 71.31 71.09 DecisionTree 92.75 92.87 92.75 92.74
from our study is that even without those direct measures, data augmentation. This finding is clinically relevant,
reliable classification (~75% F1 score) is possible by where in many settings (e.g., telehealth surveys, electronic
leveraging diet and lifestyle features through synthetic records lacking anthropometric data, or privacy-preserved
Volume 2 Issue 4 (2025) 67 doi: 10.36922/AIH025140027