
Page 74 - AIH-2-4
P. 74
Artificial Intelligence in Health Synthetic data for obesity level prediction
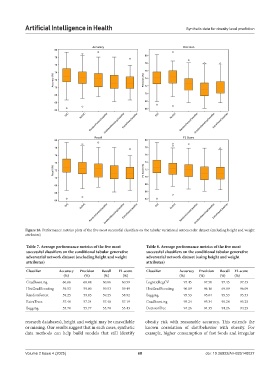
Figure 28. Performance metrics plots of the five most successful classifiers on the tabular variational autoencoder dataset (excluding height and weight
attributes)
Table 7. Average performance metrics of the five most Table 8. Average performance metrics of the five most
successful classifiers on the conditional tabular generative successful classifiers on the conditional tabular generative
adversarial network dataset (excluding height and weight adversarial network dataset (using height and weight
attributes) attributes)
Classifier Accuracy Precision Recall F1‑score Classifier Accuracy Precision Recall F1‑score
(%) (%) (%) (%) (%) (%) (%) (%)
GradBoosting 60.66 60.88 60.66 60.59 LogisticRegCV 97.45 97.50 97.45 97.45
HistGradBoosting 59.53 59.80 59.53 59.49 HistGradBoosting 96.09 96.16 69.09 96.09
RandomForest 59.25 59.03 59.25 58.92 Bagging 95.53 95.64 95.53 95.53
ExtraTrees 57.40 57.34 57.40 57.19 GradBoosting 95.24 95.34 95.24 95.25
Bagging 55.70 55.77 55.70 55.43 DecisionTree 94.26 94.35 94.26 94.25
research databases), height and weight may be unavailable obesity risk with reasonable accuracy. This extends the
or missing. Our results suggest that in such cases, synthetic known correlation of diet/behavior with obesity. For
data methods can help build models that still identify example, higher consumption of fast foods and irregular
Volume 2 Issue 4 (2025) 68 doi: 10.36922/AIH025140027