
Page 71 - AIH-2-4
P. 71
Artificial Intelligence in Health Synthetic data for obesity level prediction
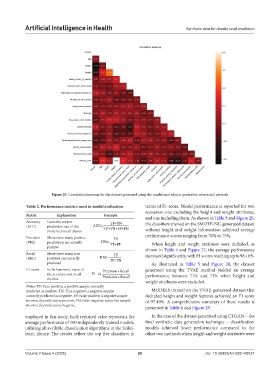
Figure 25. Correlation heatmap for the dataset generated using the conditional tabular generative adversarial network
Table 2. Performance metrics used in model evaluation terms of F1-score. Model performance is reported for two
scenarios: one excluding the height and weight attributes,
Metric Explanation Formula
and one including them. As shown in Table 3 and Figure 26,
Accuracy Gives the correct TP+TN the classifiers trained on the SMOTE-NC-generated dataset
(ACC) prediction rate of the ACC= TP+TN+FP+FN
model across all classes without height and weight information achieved average
Precision Shows how many positive TP performance scores ranging from 70% to 75%.
(PRE) predictions are actually PRE= TP+FP When height and weight attributes were included, as
positive shown in Table 4 and Figure 27, the average performance
Recall Shows how many true TP increased significantly, with F1 scores reaching up to 98.16%.
(REC) positives are correctly REC= TP+FN
predicted As illustrated in Table 5 and Figure 28, the dataset
F1-score Is the harmonic mean of Precisionx Recall generated using the TVAE method yielded an average
the accuracy and recall F1=2x performance between 71% and 73% when height and
metrics Precision +Recall
weight attributes were excluded.
Notes: TP: True positive; a positive sample correctly
predicted as positive. TN: True negative; a negative sample MODELS trained on the TVAE-generated dataset that
correctly predicted as negative. FP: False positive; a negative sample included height and weight features achieved an F1 score
incorrectly predicted as positive. FN: False negative; a positive sample of 97.49%. A comprehensive summary of these results is
incorrectly predicted as negative.
presented in Table 6 and Figure 29.
employed in this study. Each reported value represents the In the case of the dataset generated using CTGAN – the
average performance of 100 independently trained models, final synthetic data generation technique – classification
utilizing all available classification algorithms in the Scikit- models achieved lower performance compared to the
learn library. The results reflect the top five classifiers in other two methods when height and weight attributes were
Volume 2 Issue 4 (2025) 65 doi: 10.36922/AIH025140027