
Page 70 - AIH-2-4
P. 70
Artificial Intelligence in Health Synthetic data for obesity level prediction
coefficient of 0.85, was identified between obesity level and In addition to encoding, the dataset was standardized
weight, indicating a strong positive relationship. using the StandardScaler function from the Scikit-learn
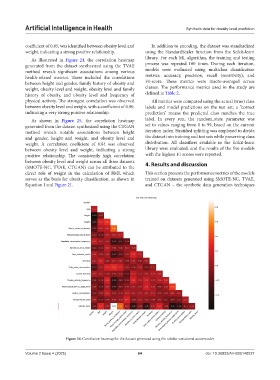
As illustrated in Figure 24, the correlation heatmap library. For each ML algorithm, the training and testing
generated from the dataset synthesized using the TVAE process was repeated 100 times. During each iteration,
method reveals significant associations among various models were evaluated using multiclass classification
health-related metrics. These included the correlations metrics: accuracy, precision, recall (sensitivity), and
between height and gender, family history of obesity and F1-score. These metrics were macro-averaged across
weight, obesity level and weight, obesity level and family classes. The performance metrics used in the study are
history of obesity, and obesity level and frequency of defined in Table 2.
physical activity. The strongest correlation was observed All metrics were computed using the actual (true) class
between obesity level and weight, with a coefficient of 0.90, labels and model predictions on the test set; a “correct
indicating a very strong positive relationship. prediction” means the predicted class matches the true
As shown in Figure 25, the correlation heatmap label. In every run, the random_state parameter was
generated from the dataset synthesized using the CTGAN set to values ranging from 0 to 99, based on the current
method reveals notable associations between height iteration index. Stratified splitting was employed to divide
and gender, height and weight, and obesity level and the dataset into training and test sets while preserving class
weight. A correlation coefficient of 0.84 was observed distribution. All classifiers available in the Scikit-learn
between obesity level and weight, indicating a strong library were evaluated, and the results of the five models
positive relationship. The consistently high correlation with the highest F1 scores were reported.
between obesity level and weight across all three datasets
(SMOTE-NC, TVAE, CTGAN) can be attributed to the 4. Results and discussion
direct role of weight in the calculation of BMI, which This section presents the performance metrics of the models
serves as the basis for obesity classification, as shown in trained on datasets generated using SMOTE-NC, TVAE,
Equation I and Figure 21. and CTGAN – the synthetic data generation techniques
Figure 24. Correlation heatmap for the dataset generated using the tabular variational autoencoder
Volume 2 Issue 4 (2025) 64 doi: 10.36922/AIH025140027