
Page 72 - AIH-2-4
P. 72
Artificial Intelligence in Health Synthetic data for obesity level prediction
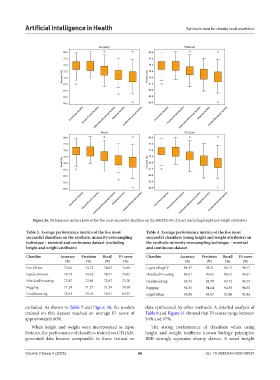
Figure 26. Performance metrics plots of the five most successful classifiers on the SMOTE-NC dataset (excluding height and weight attributes)
Table 3. Average performance metrics of the five most Table 4. Average performance metrics of the five most
successful classifiers on the synthetic minority oversampling successful classifiers (using height and weight attributes) on
technique – nominal and continuous dataset (excluding the synthetic minority oversampling technique – nominal
height and weight attributes) and continuous dataset
Classifier Accuracy Precision Recall F1‑score Classifier Accuracy Precision Recall F1‑score
(%) (%) (%) (%) (%) (%) (%) (%)
ExtraTrees 74.62 74.72 74.62 74.48 LogisticRegCV 98.17 98.21 98.17 98.17
RandomForest 74.71 74.62 74.71 74.45 HistGradBoosting 96.61 96.65 96.61 96.61
HistGradBoosting 72.87 72.89 72.87 72.70 GradBoosting 95.73 95.79 95.73 95.73
Bagging 71.24 71.27 71.24 70.98 Bagging 94.55 94.64 94.55 94.55
GradBoosting 70.31 70.19 70.31 69.91 LogisticReg 92.86 93.03 92.86 92.86
excluded. As shown in Table 7 and Figure 30, the models data synthesized by other methods. A detailed analysis of
trained on this dataset reached an average F1 score of Table 8 and Figure 31 showed that F1 scores range between
approximately 60%. 94% and 97%.
When height and weight were incorporated as input The strong performance of classifiers when using
features, the performance of classifiers trained on CTGAN- height and weight reaffirms known biology principles:
generated data became comparable to those trained on BMI strongly separates obesity classes. A novel insight
Volume 2 Issue 4 (2025) 66 doi: 10.36922/AIH025140027