
Page 220 - AJWEP-22-4
P. 220
Ma, et al.
but is instead directly influenced by dynamic porosity this standard is primarily applicable to different types
evolution within the fibrous network. 42 of fuels, it serves as a useful reference framework and
By integrating porous media combustion theory methodological guide for this study. The upper explosion
43
with fibrous fuel combustion dynamics, a porosity- limit is typically not considered as a key indicator;
44
governed combustion framework is proposed, wherein rather, it is defined as a certain density, beyond which
3D fibrous network architectures regulate combustion explosion parameters significantly decrease. Table 3
mode transitions through porosity modulation. presents the experimental data on cotton floc, including
This progression shifts from diffusion-controlled the input mass and the corresponding reaction time and
combustion in low-density regimes to deflagration utilization rate.
in critical-density zones, ultimately reaching Figure 8 illustrates the relationship between cotton
oxygen-starved combustion in high-density domains floc input mass and the corresponding utilization rate,
(ϕ < 40%). This framework advances the understanding revealing a distinct trend: as the input mass increases,
of biomass combustion behavior by elucidating the utilization rate initially declines sharply before
structural-thermochemical coupling mechanisms and gradually reaching a stable value. This relationship
provides a foundation for optimizing energy release curve can be segmented into several distinct phases:
efficiency in fibrous biofuels through targeted porosity (i) High utilization phase: At low input mass (e.g.,
engineering. The differences between conventional 0.08 g), the utilization rate approaches 1 (95.13%),
dust deflagration and cotton floc deflagration theories indicating efficient resource conversion
are presented in Table 1. (ii) Rapid decline phase: As input mass increases
Table 2 presents a comparison between the to 0.16 and 0.24 g, the utilization rate decreases
model-predicted and experimentally measured flame significantly to 55.88% and 58.17%, respectively
propagation speeds at a porosity (ϕ) of 35%. The (iii) Gradual slowdown phase: From 0.32 g onward, the
predicted speed was 1.48 m/s, while the experimental decline in utilization rate moderates, but fluctuations
value was 1.538 m/s, resulting in an error of 3.9%. This become apparent, with notable inflection points
close agreement validates the accuracy of the predictive around 0.64 g (33.88%) and 0.88 g (16.15%)
model and supports its applicability for simulating
flame behavior under similar conditions. Table 1. Comparative analysis between cotton floc
deflagration and conventional dust deflagration
3.4. Experimental data and analysis theories
Referring to GB/T 16425-2018, “Dust Cloud Explosion
Lower Concentration Determination Method,” the Property Conventional Cotton floc
dust deflagration deflagration
experiment commenced with a biomass fuel bulk
density of 80 g/m , with the subsequent increases in Oxidant supply Turbulent Porosity-guided
3
density applied in fixed-step increments. Although mechanism stochastic mixing laminar permeation
Energy release Global Directional
mode homogeneous combustion wave
reaction propagation
Key control Dust concentration Fibrous bulk density
parameter (LEL/UEL) (porosity, ϕ)
Stabilization Inert gas Active porosity
approach suppression modulation
Abbreviations: LEL: Lower explosive limit; UEL: Upper
explosive limit.
Table 2. Flame propagation speed of model
prediction versus experimental value
Output Model Experimental Error
prediction value
Flame propagation 1.48 m/s 1.538 m/s 3.9%
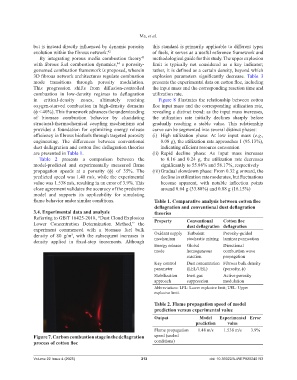
Figure 7. Carbon combustion stage in the deflagration speed (sealed
process of cotton floc conditions)
Volume 22 Issue 4 (2025) 212 doi: 10.36922/AJWEP025240193