
Page 234 - AJWEP-22-4
P. 234
Lv, et al.
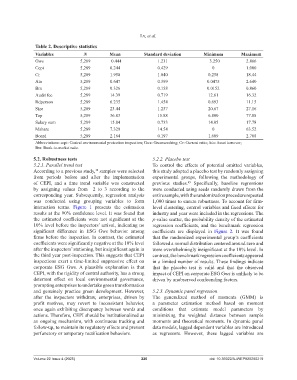
Table 2. Descriptive statistics
Variables N Mean Standard deviation Minimum Maximum
Gws 5,289 −0.444 1.231 −3.250 2.866
Cepi 5,289 0.244 0.429 0 1.000
Cr 5,289 1.950 1.840 0.258 18.44
Ato 5,289 0.647 0.399 0.0475 2.640
Bm 5,289 0.326 0.158 0.0152 0.860
Audit fee 5,289 14.39 0.719 12.61 16.32
Rdperson 5,289 6.235 1.454 0.693 11.15
Size 5,289 23.44 1.237 20.67 27.16
Top 5,289 36.83 15.88 6.800 77.88
Salary sum 5,289 15.84 0.733 14.05 17.78
Mshare 5,289 7.329 14.54 0 63.52
Board 5,289 2.164 0.197 1.609 2.708
Abbreviations: cepi: Central environmental protection inspection; Gws: Greenwashing; Cr: Current ratio; Ato: Asset turnover;
Bm: Book-to-market ratio.
5.2. Robustness tests 5.2.2. Placebo test
5.2.1. Parallel trend test To control the effects of potential omitted variables,
According to a previous study, samples were selected this study adopted a placebo test by randomly assigning
10
from periods before and after the implementation experimental groups, following the methodology of
of CEPI, and a time trend variable was constructed previous studies. Specifically, baseline regressions
45
by assigning values from −2 to 3 according to the were conducted using seeds randomly drawn from the
corresponding year. Subsequently, regression analysis entire sample, with the randomization procedure repeated
was conducted using grouping variables to form 1,000 times to ensure robustness. To account for firm-
interaction terms. Figure 1 presents the estimation level clustering, control variables and fixed effects for
results at the 90% confidence level. It was found that industry and year were included in the regressions. The
the estimated coefficients were not significant at the p-value scatter, the probability density of the estimated
10% level before the inspectors’ arrival, indicating no regression coefficients, and the benchmark regression
significant difference in ESG Gws behavior among coefficients are displayed in Figure 2. It was found
firms before the inspection. In contrast, the estimated that the randomized experimental group’s coefficients
coefficients were significantly negative at the 10% level followed a normal distribution centered around zero and
after the inspectors’ stationing, but insignificant again in were overwhelmingly insignificant at the 10% level. In
the third year post-inspection. This suggests that CEPI contrast, the benchmark regression coefficients appeared
inspections exert a time-limited suppressive effect on in a limited number of results. These findings indicate
corporate ESG Gws. A plausible explanation is that that the placebo test is valid and that the observed
CEPI, with the rigidity of central authority, has a strong impact of CEPI on corporate ESG Gws is unlikely to be
deterrent effect on local environmental governance, driven by unobserved confounding factors.
prompting enterprises to undertake green transformation
and genuinely practice green development. However, 5.2.3. Dynamic panel regression
after the inspectors withdraw, enterprises, driven by The generalized method of moments (GMM) is
profit motives, may revert to inconsistent behavior, a parameter estimation method based on moment
once again exhibiting discrepancy between words and conditions that estimate model parameters by
actions. Therefore, CEPI should be institutionalized as minimizing the weighted distance between sample
an ongoing mechanism, with continuous tracking and moments and theoretical moments. In dynamic panel
follow-up, to maintain its regulatory effects and prevent data models, lagged dependent variables are introduced
perfunctory or temporary rectification behaviors. as regressors. However, these lagged variables are
Volume 22 Issue 4 (2025) 226 doi: 10.36922/AJWEP025280219