Page 235 - AJWEP-22-4
P. 235

CEPI & ESG greenwashing: Exec. attention view

                                                                    typically correlated with the error term, resulting in a
                     Rdperson  -  -  -  -  -  -  -  -  -  -  -  1   bias in the traditional ordinary least squares estimation.
                                                                    GMM resolves this issue through the use of instrumental
                                                                    variables and moment conditions. Given the long panel
                                                                    characteristics  of the sample  used in this study, the
                     Board  -  -  -  -  -  -  -  -  -  -  1  0.041***  dynamic panel GMM estimation method can effectively
                                                                    test the persistence effect of the policy, as supported by
                                                                    prior  studies.   For  this  reason,  this  study  established
                                                                                46
                                                                    a dynamic panel model that includes a one-period lag
                     Top  -  -  -  -  -  -  -  -  -  1  0  0.011    of the dependent variable and introduces instrumental
                                                                    variables to mitigate endogeneity. The GMM estimation
                                                                    results  were  largely  consistent  with  those  from  the
                                                     0.074***  0.069***  benchmark  regression,  as  illustrated  in  Table  5. The
                     Bm  -  -  -  -  -  -  -   -           −0.062***  p-value of the second-order autocorrelation  (AR 2)
                                                  1
                                                                    was  higher  than  0.1,  suggesting  that  the  instrumental

                                                                    Hansen  test  did  not  reject  the  null  hypothesis  of
                     Ato  -  -  -  -  -  -  -  1  −0.063***  0.100***  −0.027**  0.164***  variables  were  chosen  effectively.  Furthermore,  the
                                                                    instrumental validity, confirming the robustness of the
                                                                    model specification.

                     Salary sum  -  -  -  -  -  -  1  0.096***  −0.027**  −0.104***  0.127***  0.345***  5.2.4. Sample size expansion
                                                                    To further ensure the robustness of the results, this study
                                                                    expanded the sample size for testing. Given that some
                                                                    enterprises reported missing data on R&D personnel, the
                     Audit fee  -  -  -  -  -  1  0.385***  0.112***  0.111***  0.060***  0.126***  0.379***  corresponding control variable was excluded to retain
                                                                    the  original  dataset.  Subsequently,  observations  with
                                                                    missing  values  for  other  variables  are  excluded. This
                                                                    approach  reduces  data  exclusion,  thereby  expanding
                                                                    the sample size for robustness testing. According to the
                     Cr  -  -  -  -  1  −0.279***  −0.045***  −0.144***  0.027**  −0.013  −0.102***  −0.129*** Abbreviations: cepi: Central environmental protection inspection; Gws: Greenwashing; Cr: Current ratio; Ato: Asset turnover; Bm: Book-to-market ratio.  test results (Table 6), the impact of CEPI on corporate
                                                                    ESG Gws remained significant, robust, and consistent
                                                                    with  the  previous  findings.  All  independent  variable
                                    −0.346***  0.742***  0.385***  0.043***  0.134***  0.166***  0.198***  0.460***
                     Size        1                                  coefficients were statistically significant at least at the
                                                                    10% level.
                        -
                              -
                           -
                                                                    5.3. Mechanism tests
                     Mshare  -  -  1  −0.271***  0.194***  −0.203***  0.001  −0.050***  −0.137***  −0.020  −0.183***  0.016  Fs  is  a  flexible  resource  available  to  executives,
                                                                    enabling  them  to  respond  to  external  pressures  or
                                                                    opportunities.  This  resource  affects  the  intensity
                                                                    of corporate green governance and thus serves a
                                                  −0.036***
                                                                    moderating  role.  When  executives  pay  attention  to
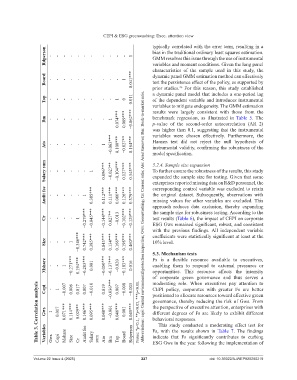
                  Table 3. Correlation analysis  Gws  Variables  1  0.017  0.071***  0.114***  0.029**  0.146***  Audit fee  0.095***  0.048***  −0.001  0.046***  0.001  0.045***  Rdperson Notes: *p<0.1, **p<0.05, ***p<0.01.  positioned to allocate resources toward effective green
                                          −0.010
                                                        −0.008
                                                           −0.003
                              −0.007
                                    0.017
                                       0.007
                                               0.019
                                                     0.007
                                 0.006
                     Cepi
                                                                    CEPI  policy,  corporates  with  greater  Fs  are  better
                           1
                        -
                                                                    governance, thereby reducing the risk of Gws. From
                                                                    the perspective of executive attention, enterprises with
                                                                    different degrees of Fs are likely to exhibit different
                                                                    behavioral responses.
                                                                       This  study  conducted  a  moderating  effect  test  for
                                                                    Fs,  with  the  results  shown  in  Table  7.  The  findings
                              Mshare
                           Cepi
                        Gws
                                 Size
                                                                    ESG Gws in the year following the implementation of
                                                                                             doi: 10.36922/AJWEP025280219
                Volume 22 Issue 4 (2025)   Cr  Salary   sum  Ato  Bm  Top  Board  227   indicate  that  Fs  significantly  contributes  to  curbing
   230   231   232   233   234   235   236   237   238   239   240