Page 236 - AJWEP-22-4
P. 236

Lv, et al.

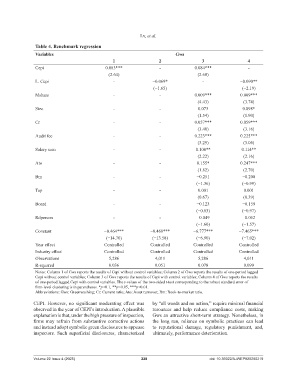
                 Table 4. Benchmark regression
                 Variables                                                    Gws
                                                   1                   2                  3                   4
                 Cepi                          0.083***                -               0.084***               -
                                                 (2.64)                                 (2.68)
                 L. Cepi                           -                −0.069*               -                −0.090**
                                                                     (−1.65)                                (−2.19)
                 Mshare                            -                   -               0.009***            0.009***
                                                                                        (4.43)              (3.74)
                 Size                              -                   -                0.073               0.098*
                                                                                        (1.54)              (1.90)
                 Cr                                -                   -               0.057***            0.059***
                                                                                        (3.40)              (3.16)
                 Audit fee                         -                   -               0.223***            0.225***
                                                                                        (3.29)              (3.06)
                 Salary sum                        -                   -               0.108**             0.114**
                                                                                        (2.22)              (2.16)
                 Ato                               -                   -                0.155*             0.247***
                                                                                        (1.82)              (2.70)
                 Bm                                -                   -                −0.251              −0.200
                                                                                       (−1.36)              (−0.99)
                 Top                               -                   -                0.001               0.001
                                                                                        (0.67)              (0.39)
                 Board                             -                   -                −0.123              −0.159
                                                                                       (−0.83)              (−0.97)
                 Rdperson                          -                   -                −0.049              −0.052
                                                                                       (−1.60)              (−1.57)
                 Constant                      −0.464***           −0.468***          −6.777***           −7.465***
                                                (−14.70)            (−13.58)           (−6.90)              (−7.02)
                 Year effect                   Controlled          Controlled         Controlled          Controlled
                 Industry effect               Controlled          Controlled         Controlled          Controlled
                 Observations                    5,286               4,011              5,286               4,011
                 R-squared                       0.036               0.051              0.078               0.099
                 Notes: Column 1 of Gws reports the results of Cepi without control variables; Column 2 of Gws reports the results of one-period lagged
                 Cepi without control variables; Column 3 of Gws reports the results of Cepi with control variables; Column 4 of Gws reports the results
                 of one-period lagged Cepi with control variables. The t-values of the two-sided t-test corresponding to the robust standard error of
                 firm-level clustering is in parentheses. *p<0.1, **p<0.05, ***p<0.01.
                 Abbreviations: Gws: Greenwashing; Cr: Current ratio; Ato: Asset turnover; Bm: Book-to-market ratio.

                CEPI. However, no significant moderating effect was   by “all words and no action,” require minimal financial
                observed in the year of CEPI’s introduction. A plausible   resources  and  help  reduce  compliance  costs,  making
                explanation is that, under the high pressure of inspection,   Gws an attractive short-term strategy. Nonetheless, in
                firms  may  refrain  from  substantive  corrective  actions   the long run, reliance on symbolic practices can lead
                and instead adopt symbolic green disclosures to appease   to  reputational damage,  regulatory  punishment,  and,
                inspectors.  Such  superficial  disclosures,  characterized   ultimately, performance deterioration.


                Volume 22 Issue 4 (2025)                       228                           doi: 10.36922/AJWEP025280219
   231   232   233   234   235   236   237   238   239   240   241