
Page 240 - AJWEP-22-4
P. 240
Lv, et al.
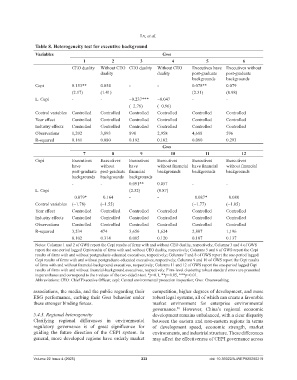
Table 8. Heterogeneity test for executive background
Variables Gws
1 2 3 4 5 6
CEO duality Without CEO CEO duality Without CEO Executives have Executives without
duality duality post-graduate post-graduate
backgrounds backgrounds
Cepi 0.153** 0.054 - - 0.078** 0.079
(2.17) (1.41) (2.31) (0.98)
L. Cepi - - −0.237*** −0.047 - -
(−2.76) (−0.96)
Control variables Controlled Controlled Controlled Controlled Controlled Controlled
Year effect Controlled Controlled Controlled Controlled Controlled Controlled
Industry effects Controlled Controlled Controlled Controlled Controlled Controlled
Observations 1,202 3,893 898 2,958 4,688 596
R-squared 0.161 0.080 0.192 0.102 0.080 0.293
Gws
7 8 9 10 11 12
Cepi Executives Executives Executives Executives Executives Executives
have without have without financial have financial without financial
post-graduate post-graduate financial backgrounds backgrounds backgrounds
backgrounds backgrounds backgrounds
- - 0.091** 0.057 - -
L. Cepi (2.32) (0.87)
−0.079* −0.164 - - −0.087* −0.080
Control variables (−1.78) (−1.55) (−1.77) (−1.05)
Year effect Controlled Controlled Controlled Controlled Controlled Controlled
Industry effects Controlled Controlled Controlled Controlled Controlled Controlled
Observations Controlled Controlled Controlled Controlled Controlled Controlled
R-squared 3,534 474 3,656 1,624 2,807 1,196
0.102 0.314 0.085 0.120 0.107 0.137
Notes: Columns 1 and 2 of GWS report the Cepi results of firms with and without CEO duality, respectively; Columns 3 and 4 of GWS
report the one-period lagged Cepi results of firms with and without CEO duality, respectively; Columns 5 and 6 of GWS report the Cepi
results of firms with and without postgraduate-educated executives, respectively; Columns 7 and 8 of GWS report the one-period lagged
Cepi results of firms with and without postgraduate-educated executives, respectively; Columns 9 and 10 of GWS report the Cepi results
of firms with and without financial-background executives, respectively; Columns 11 and 12 of GWS report the one-period lagged Cepi
results of firms with and without financial-background executives, respectively. Firm-level clustering robust standard errors are presented
in parentheses and correspond to the t-values of the two-sided t-test. *p<0.1, **p<0.05, ***p<0.01.
Abbreviations: CEO: Chief Executive Officer; cepi: Central environmental protection inspection; Gws: Greenwashing.
associations, the media, and the public regarding their competition, higher degrees of development, and more
ESG performance, curbing their Gws behavior under robust legal systems, all of which can create a favorable
these stronger binding forces. market environment for enterprise environmental
governance. However, China’s regional economic
50
5.4.3. Regional heterogeneity development remains unbalanced, with a clear disparity
Clarifying regional differences in environmental between the eastern and non-eastern regions in terms
regulatory governance is of great significance for of development speed, economic strength, market
guiding the future direction of the CEPI system. In environments, and industrial structure. These differences
general, more developed regions have orderly market may affect the effectiveness of CEPI governance across
Volume 22 Issue 4 (2025) 232 doi: 10.36922/AJWEP025280219