
Page 237 - AJWEP-22-4
P. 237
CEPI & ESG greenwashing: Exec. attention view
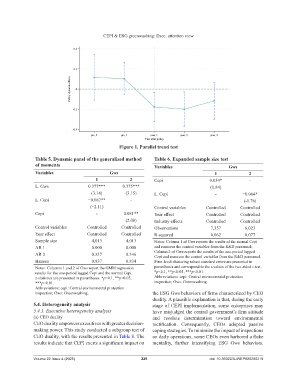
Figure 1. Parallel trend test
Table 5. Dynamic panel of the generalized method Table 6. Expanded sample size test
of moments Variables Gws
Variables Gws 1 2
1 2 Cepi 0.054* -
L. Gws 0.377*** 0.375*** (1.84)
(3.14) (3.15) L. Cepi - −0.064*
L. Cepi −0.087** - (-1.76)
(−2.11) Control variables Controlled Controlled
Cepi - 0.081** Year effect Controlled Controlled
(2.08) Industry effects Controlled Controlled
Control variables Controlled Controlled Observations 7,357 6,023
Year effect Controlled Controlled R-squared 0.062 0.077
Sample size 4,013 4,013 Notes: Column 1 of Gws reports the results of the normal Cepi
AR 1 0.000 0.000 and removes the control variables from the R&D personnel;
AR 2 0.337 0.346 Column 2 of Gws reports the results of the one-period lagged
Cepi and removes the control variables from the R&D personnel.
Hansen 0.837 0.834 Firm-level clustering robust standard errors are presented in
Notes: Columns 1 and 2 of Gws report the GMM regression parentheses and correspond to the t-values of the two-sided t-test.
results for the one-period lagged Cepi and the normal Cepi. *p<0.1, **p<0.05, ***p<0.01.
z-statistics are presented in parentheses. *p<0.1, **p<0.05, Abbreviations: cepi: Central environmental protection
***p<0.01. inspection; Gws: Greenwashing.
Abbreviations: cepi: Central environmental protection
inspection; Gws: Greenwashing. the ESG Gws behaviors of firms characterized by CEO
duality. A plausible explanation is that, during the early
5.4. Heterogeneity analysis stage of CEPI implementation, some enterprises may
5.4.1. Executive heterogeneity analysis have misjudged the central government’s firm attitude
(a) CEO duality and resolute determination toward environmental
CEO duality empowers executives with greater decision- rectification. Consequently, CEOs adopted passive
making power. This study conducted a subgroup test of coping strategies. To minimize the impact of inspections
CEO duality, with the results presented in Table 8. The on daily operations, some CEOs even harbored a fluke
results indicate that CEPI exerts a significant impact on mentality, further intensifying ESG Gws behaviors.
Volume 22 Issue 4 (2025) 229 doi: 10.36922/AJWEP025280219