
Page 122 - AJWEP-22-5
P. 122
Nkinda, et al.
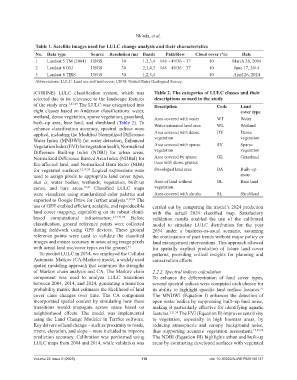
Table 1. Satellite images used for LULC change analysis and their characteristics
No. Data type Source Resolution (m) Bands Path/Row Cloud cover (%) Date
1 Landsat 5 TM (2004) USGS 30 1,2,3,4 148 – 49/36 – 37 10 March 28, 2004
2 Landsat 8 OLI USGS 30 2,3,4,5 148 – 49/36 – 37 10 June 17, 2014
3 Landsat 8 TIRS USGS 30 1,2,3,4 10 April 26, 2024
Abbreviations: LULC: Land use and land cover; USGS: United States Geological Survey.
(CORINE) LULC classification system, which was Table 2. The categories of LULC classes and their
selected due to its relevance to the landscape features descriptions as used in the study
of the study area. 7,47-49 The LULC was categorized into Description Code Land
eight classes based on Anderson classifications: water, cover type
wetland, dense vegetation, sparse vegetation, grassland, Area covered with water WT Water
built–up area, bare land, and shrubland (Table 2). To
enhance classification accuracy, spectral indices were Water-saturated land area WL Wetland
applied, including the Modified Normalized Difference Area covered with dense DV Dense
Water Index (MNDWI) for water detection, Enhanced vegetation vegetation
Vegetation Index (EVI) for vegetation health, Normalized Area covered with sparse SV Sparse
Difference Built-up Index (NDBI) for urban areas, vegetation vegetation
Normalized Difference Burned Area Index (NDBaI) for Area covered by sparse GL Grassland
fire-affected land, and Normalized Burn Ratio (NBR) trees with dense grasses
for vegetated surfaces. 12,19,50 Logical expressions were Developed land area BA Built–up
used to assign pixels to appropriate land cover types, areas
that is, water bodies, wetlands, vegetation, built-up Area of land without BL Bare land
zones, and bare areas. 18,31 Classified LULC maps vegetation
were visualized using standardized color palettes and Area covered with shrubs SL Shrubland
exported to Google Drive for further analysis. 6,12,24 The
use of GEE enabled efficient, scalable, and reproducible carried out by comparing the model’s 2024 prediction
land cover mapping, capitalizing on its robust cloud- with the actual 2024 classified map. Satisfactory
based computational infrastructure. 2,15,51,52 Before validation results enabled the use of the calibrated
classification, ground reference points were collected model to simulate LULC distribution for the year
during fieldwork using GPS devices. These ground 2034 under a business-as-usual scenario, assuming
reference points were used to validate the classified the continuation of past trends without major policy or
images and ensure accuracy in associating image pixels land management interventions. This approach allowed
with actual land use/cover types on the ground. 53 for spatially explicit prediction of future land cover
To predict LULC in 2034, we employed the Cellular patterns, providing critical insights for planning and
Automata–Markov (CA-Markov) model, a widely used conservation efforts.
spatial modeling approach that combines the strengths
of Markov chain analysis and CA. The Markov chain 2.2.2. Spectral indices calculation
component was used to analyze LULC transitions To enhance the differentiation of land cover types,
between 2004, 2014, and 2024, generating a transition several spectral indices were computed each chosen for
probability matrix that estimates the likelihood of land its ability to highlight specific land surface features.
51
cover class changes over time. The CA component The MNDWI (Equation I) enhances the detection of
incorporated spatial context by simulating how these open water bodies by suppressing built–up land noise,
transitions would propagate across space based on making it particularly effective for identifying aquatic
neighborhood effects. The model was implemented features. 2,11,54 The EVI (Equation II) improves sensitivity
using the Land Change Modeler in TerrSet software. to vegetation, especially in high biomass areas, by
Key drivers of land change – such as proximity to roads, reducing atmospheric and canopy background noise,
rivers, elevation, and slope – were included to improve thus supporting accurate vegetation assessment. 17,55,56
prediction accuracy. Calibration was performed using The NDBI (Equation III) highlights urban and built-up
LULC maps from 2004 and 2014, while validation was areas by contrasting developed surfaces with vegetated
Volume 22 Issue 5 (2025) 116 doi: 10.36922/AJWEP025180137