
Page 124 - AJWEP-22-5
P. 124
Nkinda, et al.
( Current LULC area − transformations in landscape composition, primarily
driven by anthropogenic activities, as illustrated in
Percentage change = Previous LULC area) (VII) Table 4. The results showed a marked decline in
( Previouus LULC area)
vegetated areas over the two decades, accompanied by
a significant increase in bare land and built–up areas
2.2.4. Human activities performed along the (Table 4).
Ngerengere River catchment In 2004, sparse vegetation was the dominant land
Between March and April 2025, systematic field cover type in the Ngerengere River catchment, covering
surveys were conducted along ten 150-m transects to 50.92% (1416 km ) of the total area. This was followed
2
assess anthropogenic activities contributing to LULCCs by bare land, which accounted for 30.56% (850 km ), and
2
within the Ngerengere River sub-catchment. Observed shrubland at 11.21% (312 km ) (Table 4 and Figure 3).
2
activities were geolocated using GPS devices to enable Grassland made up 5.57% of the total area (155 km ),
2
accurate spatial mapping and analysis. In addition, while built–up areas were minimal, covering only
spectral indices – including the Normalized Difference 0.67% (19 km ). Dense vegetation and wetlands were
2
Vegetation Index, NDBI, and MNDWI – were applied extremely limited, occupying just 0.04% (1 km ) and
2
to satellite imagery to detect and monitor spatial patterns 0.04% (1 km ), respectively (Table 4 and Figure 3).
2
of environmental change, such as deforestation, urban Water bodies covered 0.98% (27 km ) of the area.
2
expansion, and water body shrinkage. These approaches The predominance of sparse vegetation and bare
allowed for the integration of field-based observations land indicates that the river catchment was largely
with remotely sensed data to evaluate the extent and characterized by semi–arid conditions with limited
impact of anthropogenic activities within the catchment. forest cover (Figure 3).
By 2014, the Ngerengere River catchment experienced
3. Results marked LULCCs, reflecting intensified human activity
and environmental pressures (Table 4 and Figure 4).
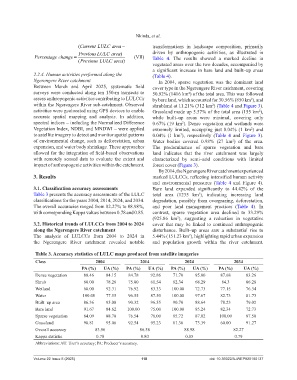
3.1. Classification accuracy assessments Bare land expanded significantly to 44.42% of the
Table 3 presents the accuracy assessments of the LULC total area (1235 km ), indicating increasing land
2
classifications for the years 2004, 2014, 2024, and 2034. degradation, possibly from overgrazing, deforestation,
The overall accuracies ranged from 82.27% to 88.98%, and poor land management practices (Table 4). In
with corresponding Kappa values between 0.78 and 0.85. contrast, sparse vegetation area declined to 33.29%
(925.86 km ), suggesting a reduction in vegetative
2
3.2. Historical trends of LULCCs from 2004 to 2024 cover that may be linked to continued anthropogenic
along the Ngerengere River catchment disturbance. Built–up areas saw a substantial rise to
The analysis of LULCCs from 2004 to 2024 in 5.44% (151.23 km ), highlighting rapid urban expansion
2
the Ngerengere River catchment revealed notable and population growth within the river catchment.
Table 3. Accuracy statistics of LULC maps produced from satellite imageries
Class 2004 2014 2024 2034
PA (%) UA (%) PA (%) UA (%) PA (%) UA (%) PA (%) UA (%)
Dense vegetation 88.46 84.15 84.78 92.86 71.70 95.00 87.68 83.26
Shrub 60.00 78.26 75.00 61.54 82.34 68.29 84.3 86.28
Wetland 60.00 92.31 76.92 83.33 100.00 72.73 77.15 76.34
Water 100.00 77.55 96.55 87.50 100.00 97.67 82.73 81.73
Built–up area 86.36 95.00 90.32 96.55 90.70 88.64 78.23 79.02
Bare land 91.67 84.62 100.00 75.00 100.00 95.24 82.34 72.73
Sparse vegetation 84.09 88.70 76.54 78.00 85.72 87.02 100.00 87.50
Grassland 90.81 95.06 92.54 95.23 81.36 73.39 60.00 91.27
Overall accuracy 83.96 86.58 88.98 82.27
Kappa statistic 0.78 0.80 0.85 0.79
Abbreviations: AU: User’s accuracy; PA: Producer’s accuracy.
Volume 22 Issue 5 (2025) 118 doi: 10.36922/AJWEP025180137