
Page 126 - AJWEP-22-5
P. 126
Nkinda, et al.
Figure 4. Spatial distribution of land cover in Ngerengere River catchment in 2014
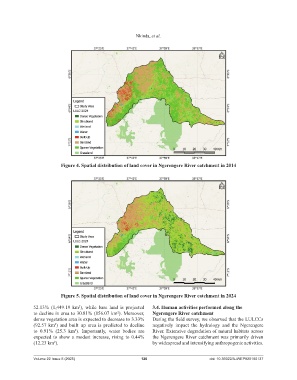
Figure 5. Spatial distribution of land cover in Ngerengere River catchment in 2024
52.13% (1,449.19 km ), while bare land is projected 3.4. Human activities performed along the
2
to decline in area to 30.81% (856.07 km ). Moreover, Ngerengere River catchment
2
dense vegetation area is expected to decrease to 3.33% During the field survey, we observed that the LULCCs
(92.57 km ) and built–up area is predicted to decline negatively impact the hydrology and the Ngerengere
2
to 0.91% (25.3 km ). Importantly, water bodies are River. Extensive degradation of natural habitats across
2
expected to show a modest increase, rising to 0.44% the Ngerengere River catchment was primarily driven
(12.23 km ). by widespread and intensifying anthropogenic activities.
2
Volume 22 Issue 5 (2025) 120 doi: 10.36922/AJWEP025180137