
Page 127 - AJWEP-22-5
P. 127
Land–cover change in the Ngerengere River
Figure 6. Spatial distribution of future land cover in Ngerengere River catchment in 2034
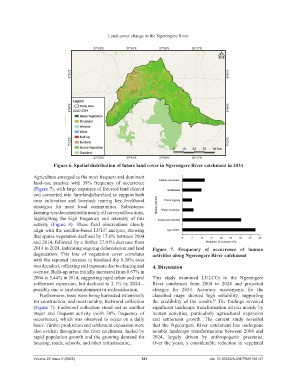
Agriculture emerged as the most frequent and dominant
land–use practice with 38% frequency of occurrence
(Figure 7), with large expanses of forested land cleared
and converted into farmlands/bareland to support both
crop cultivation and livestock rearing key livelihood
strategies for most local communities. Subsistence
farming was documented in nearly all surveyed locations,
highlighting the high frequency and intensity of this
activity (Figure 8). These field observations closely
align with the satellite-based LULC analysis, showing
that sparse vegetation declined by 17.6% between 2004
and 2014, followed by a further 27.01% decrease from
2014 to 2024, indicating ongoing deforestation and land Figure 7. Frequency of occurrence of human
degradation. This loss of vegetation cover correlates activities along Ngerengere River catchment
with the reported increase in bareland (by 8.58% over
two decades), reflecting soil exposure due to clearing and 4. Discussion
overuse. Built-up areas initially increased from 0.67% in
2004 to 5.44% in 2014, suggesting rapid urban and rural This study examined LULCCs in the Ngerengere
settlement expansion, but declined to 2.1% by 2024 – River catchment from 2004 to 2024 and projected
possibly due to land abandonment or reclassification. changes for 2034. Accuracy assessments for the
Furthermore, trees were being harvested extensively classified maps showed high reliability, supporting
for construction, and most notably, fuelwood collection the credibility of the results. The findings revealed
39
(Figure 7). Fuelwood collection stood out as another significant landscape transformation driven mainly by
major and frequent activity (with 30% frequency of human activities, particularly agricultural expansion
occurrence), which was observed to occur on a daily and settlement growth. The current study revealed
basis. Timber production and settlement expansion were that the Ngerengere River catchment has undergone
also evident throughout the river catchment, fueled by notable landscape transformations between 2004 and
rapid population growth and the growing demand for 2024, largely driven by anthropogenic pressures.
housing, roads, schools, and other infrastructure. Over the years, a considerable reduction in vegetated
Volume 22 Issue 5 (2025) 121 doi: 10.36922/AJWEP025180137