
Page 174 - AJWEP-22-5
P. 174
Wang, et al.
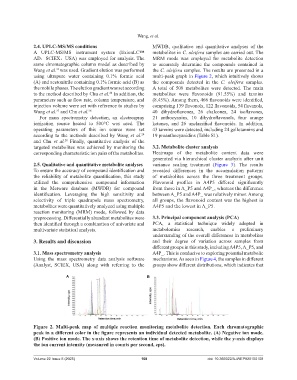
2.4. UPLC-MS/MS conditions MWDB, qualitative and quantitative analyses of the
A UPLC-MS/MS instrument system (ExionLC™ metabolites in C. oleifera samples are carried out. The
AD,SCIEX,USA) was employed for analysis. The MRM mode was employed for metabolite detection
same chromatographic column model as described by to accurately determine the compounds contained in
Wang et al. was used. Gradient elution was performed the C. oleifera samples. The results are presented in a
24
using ultrapure water containing 0.1% formic acid multi-peak graph in Figure 2, which intuitively shows
(A) and acetonitrile containing 0.1% formic acid (B) as the compounds detected in the C. oleifera samples.
the mobile phases. The elution gradient was set according A total of 509 metabolites were detected. The main
to the method described by Chu et al. In addition, the metabolites were flavonoids (91.55%) and tannins
28
parameters such as flow rate, column temperature, and (8.45%). Among them, 466 flavonoids were identified,
injection volume were set with reference to studies by comprising 139 flavonols, 122 flavonoids, 54 flavanols,
Wang et al. and Chu et al. 28 40 dihydroflavones, 26 chalcones, 24 isoflavones,
27
For mass spectrometry detection, an electrospray 21 anthocyanins, 10 dihydroflavonols, four orange
ionization source heated to 500°C was used. The ketones, and 26 unclassified flavonoids. In addition,
operating parameters of this ion source were set 43 tannins were detected, including 24 gallotannins and
according to the methods described by Wang et al. 19 proanthocyanidins (Table S1).
24
and Chu et al. Finally, quantitative analysis of the
28
targeted metabolites was achieved by monitoring the 3.2. Metabolite cluster analysis
corresponding characteristic ion pairs of the metabolites. Heatmaps of the metabolite content data were
generated via hierarchical cluster analysis after unit
2.5. Qualitative and quantitative metabolite analyses variance scaling treatment (Figure 3). The results
To ensure the accuracy of compound identification and revealed differences in the accumulation patterns
the reliability of metabolite quantification, this study of metabolites across the three treatment groups.
utilized the comprehensive compound information Flavonoid profiles in A4P5 differed significantly
in the Metware database (MWDB) for compound from those in A_P5 and A4P_, whereas the difference
identification. Leveraging the high sensitivity and between A_P5 and A4P_ was relatively minor. Among
selectivity of triple quadrupole mass spectrometry, all groups, the flavonoid content was the highest in
metabolites were quantitatively analyzed using multiple A4P5 and the lowest in A_P5.
reaction monitoring (MRM) mode, followed by data
preprocessing. Differentially abundant metabolites were 3.3. Principal component analysis (PCA)
then identified through a combination of univariate and PCA, a statistical technique widely adopted in
multivariate statistical analysis. metabolomics research, enables a preliminary
understanding of the overall differences in metabolites
3. Results and discussion and their degree of variation across samples from
different groups in this study, including A4P5, A_P5, and
3.1. Mass spectrometry analysis A4P_. This is conducive to exploring potential metabolic
Using the mass spectrometry data analysis software mechanisms. As seen in Figure 4, the samples in different
(Analyst, SCIEX, USA) along with referring to the groups show different distributions, which indicates that
A B
Figure 2. Multi-peak map of multiple reaction monitoring metabolite detection. Each chromatographic
peak in a different color in the figure represents an individual detected metabolite. (A) Negative ion mode.
(B) Positive ion mode. The x-axis shows the retention time of metabolite detection, while the y-axis displays
the ion current intensity (measured in counts per second, cps).
Volume 22 Issue 5 (2025) 168 doi: 10.366922/AJWEP025150108