
Page 177 - AJWEP-22-5
P. 177
Alleviating aluminum toxicity
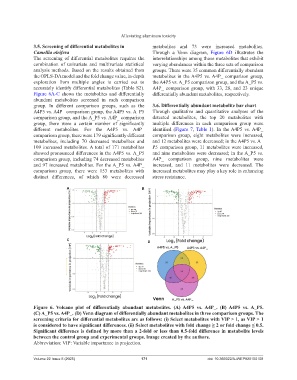
3.5. Screening of differential metabolites in metabolites and 73 were increased metabolites.
Camellia oleifera Through a Venn diagram, Figure 6D illustrates the
The screening of differential metabolites requires the interrelationships among those metabolites that exhibit
combination of univariate and multivariate statistical varying abundances within the three sets of comparison
analysis methods. Based on the results obtained from groups. There were 35 common differentially abundant
the OPLS-DA model and the fold change value, in-depth metabolites in the A4P5 vs. A4P_ comparison group,
exploration from multiple angles is carried out to the A4P5 vs. A_P5 comparison group, and the A_P5 vs.
accurately identify differential metabolites (Table S2). A4P_ comparison group, with 33, 28, and 23 unique
Figure 6A-C shows the metabolites and differentially differentially abundant metabolites, respectively.
abundant metabolites screened in each comparison
group. In different comparison groups, such as the 3.6. Differentially abundant metabolite bar chart
A4P5 vs. A4P_ comparison group, the A4P5 vs. A_P5 Through qualitative and quantitative analyses of the
comparison group, and the A_P5 vs. A4P_ comparison detected metabolites, the top 20 metabolites with
group, there were a certain number of significantly multiple differences in each comparison group were
different metabolites. For the A4P5 vs. A4P_ identified (Figure 7, Table 1). In the A4P5 vs. A4P_
comparison group, there were 179 significantly different comparison group, eight metabolites were increased,
metabolites, including 70 decreased metabolites and and 12 metabolites were decreased; in the A4P5 vs. A_
109 increased metabolites. A total of 171 metabolites P5 comparison group, 11 metabolites were increased,
showed pronounced differences in the A4P5 vs. A_P5 and nine metabolites were decreased; in the A_P5 vs.
comparison group, including 74 decreased metabolites A4P_ comparison group, nine metabolites were
and 97 increased metabolites. For the A_P5 vs. A4P_ increased, and 11 metabolites were decreased. The
comparison group, there were 153 metabolites with increased metabolites may play a key role in enhancing
distinct differences, of which 80 were decreased stress resistance.
A B
C D
Figure 6. Volcano plot of differentially abundant metabolites. (A) A4P5 vs. A4P_. (B) A4P5 vs. A_P5.
(C) A_P5 vs. A4P_. (D) Venn diagram of differentially abundant metabolites in three comparison groups. The
screening criteria for differential metabolites are as follows: (i) Select metabolites with VIP > 1, as VIP > 1
is considered to have significant differences. (ii) Select metabolites with fold change ≥ 2 or fold change ≤ 0.5.
Significant difference is defined by more than a 2-fold or less than 0.5-fold difference in metabolite levels
between the control group and experimental groups. Image created by the authors.
Abbreviation: VIP: Variable importance in projection.
Volume 22 Issue 5 (2025) 171 doi: 10.366922/AJWEP025150108