
Page 178 - AJWEP-22-5
P. 178
Wang, et al.
A B
C
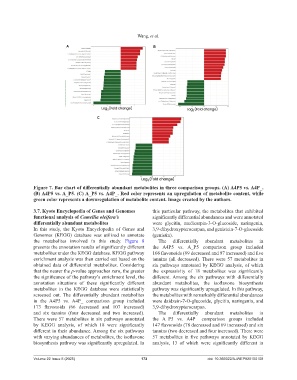
Figure 7. Bar chart of differentially abundant metabolites in three comparison groups. (A) A4P5 vs. A4P_.
(B) A4P5 vs. A_P5. (C) A_P5 vs. A4P_. Red color represents an upregulation of metabolite content, while
green color represents a downregulation of metabolite content. Image created by the authors.
3.7. Kyoto Encyclopedia of Genes and Genomes this particular pathway, the metabolites that exhibited
functional analysis of Camellia oleifera’s significantly differential abundances and were annotated
differentially abundant metabolites were glycitin, medicarpin-3-O-glucoside, naringenin,
In this study, the Kyoto Encyclopedia of Genes and 3,9-dihydroxypterocarpan, and genistein-7-O-glucoside
Genomes (KEGG) database was utilized to annotate (genistin).
the metabolites involved in this study. Figure 8 The differentially abundant metabolites in
presents the annotation results of significantly different the A4P5 vs. A_P5 comparison group included
metabolites under the KEGG database. KEGG pathway 166 flavonoids (69 decreased and 97 increased) and five
enrichment analysis was then carried out based on the tannins (all decreased). There were 57 metabolites in
obtained data of differential metabolites. Considering six pathways annotated by KEGG analysis, of which
that the nearer the p-value approaches zero, the greater the expressivity of 18 metabolites was significantly
the significance of the pathway’s enrichment level, the different. Among the six pathways with differentially
annotation situations of these significantly different abundant metabolites, the isoflavone biosynthesis
metabolites in the KEGG database were statistically pathway was significantly upregulated. In this pathway,
screened out. The differentially abundant metabolites the metabolites with remarkably differential abundances
in the A4P5 vs. A4P_ comparison group included were daidzein-7-O-glucoside, glycitin, naringenin, and
173 flavonoids (66 decreased and 107 increased) 3,9-dihydroxypterocarpan.
and six tannins (four decreased and two increased). The differentially abundant metabolites in
There were 57 metabolites in six pathways annotated the A_P5 vs. A4P_ comparison groups included
by KEGG analysis, of which 18 were significantly 147 flavonoids (78 decreased and 69 increased) and six
different in their abundance. Among the six pathways tannins (two decreased and four increased). There were
with varying abundances of metabolites, the isoflavone 57 metabolites in five pathways annotated by KEGG
biosynthesis pathway was significantly upregulated. In analysis, 13 of which were significantly different in
Volume 22 Issue 5 (2025) 172 doi: 10.366922/AJWEP025150108