
Page 175 - AJWEP-22-5
P. 175
Alleviating aluminum toxicity
A B
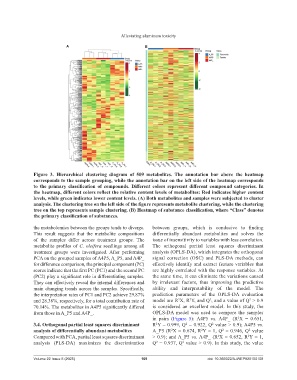
Figure 3. Hierarchical clustering diagram of 509 metabolites. The annotation bar above the heatmap
corresponds to the sample grouping, while the annotation bar on the left side of the heatmap corresponds
to the primary classification of compounds. Different colors represent different compound categories. In
the heatmap, different colors reflect the relative content levels of metabolites: Red indicates higher content
levels, while green indicates lower content levels. (A) Both metabolites and samples were subjected to cluster
analysis. The clustering tree on the left side of the figure represents metabolite clustering, while the clustering
tree on the top represents sample clustering. (B) Heatmap of substance classification, where “Class” denotes
the primary classification of substances.
the metabolomics between the groups tends to diverge. between groups, which is conducive to finding
This result suggests that the metabolite compositions differentially abundant metabolites and solves the
of the samples differ across treatment groups. The issue of insensitivity to variables with less correlation.
metabolite profiles of C. oleifera seedlings among all The orthogonal partial least squares discriminant
treatment groups were investigated. After performing analysis (OPLS-DA), which integrates the orthogonal
PCA on the grouped samples of A4P5, A_P5, and A4P_ signal correction (OSC) and PLS-DA methods, can
for difference comparison, the principal component (PC) effectively identify and extract feature variables that
scores indicate that the first PC (PC1) and the second PC are highly correlated with the response variables. At
(PC2) play a significant role in differentiating samples. the same time, it can eliminate the variations caused
They can effectively reveal the internal differences and by irrelevant factors, thus improving the predictive
main changing trends across the samples. Specifically, ability and interpretability of the model. The
the interpretation rates of PC1 and PC2 achieve 29.87% prediction parameters of the OPLS-DA evaluation
2
2
2
2
and 28.38%, respectively, for a total contribution rate of model are R X, R Y, and Q , and a value of Q > 0.9
70.14%. The metabolites in A4P5 significantly differed is considered an excellent model. In this study, the
from those in A_P5 and A4P_. OPLS-DA model was used to compare the samples
in pairs (Figure 5): A4P5 vs. A4P_ (R X = 0.651,
2
3.4. Orthogonal partial least squares discriminant R Y = 0.999, Q = 0.922, Q value > 0.9); A4P5 vs.
2
2
2
analysis of differentially abundant metabolites A_P5 (R X = 0.674, R Y = 1, Q = 0.946, Q value
2
2
2
2
Compared with PCA, partial least squares discriminant > 0.9); and A_P5 vs. A4P_ (R X = 0.652, R Y = 1,
2
2
analysis (PLS-DA) maximizes the discrimination Q = 0.937, Q value > 0.9). In this study, the value
2
2
Volume 22 Issue 5 (2025) 169 doi: 10.366922/AJWEP025150108