
Page 94 - AJWEP-22-5
P. 94
Fan, et al.
characteristics and hydrogeological conditions of the quarterly sampling and compliance with national
study area, the Natural Breaks classification method in standards – GB/T 14848-2017 for groundwater and
ArcGIS (Esri, Inc., USA) was employed to integrate GB 3838-2002 for surface water – with multiple types
the quantitative and qualitative evaluation results of parameters measured. Geological surveys provided
using a 1:1 weighting ratio. The final comprehensive information on the types and thicknesses of riverbed
suitability grading of the water source site is presented sediments, which were analyzed to assess their impact
in Table 5. on lateral recharge capacity.
Based on borehole logs and pumping test data, the
4. Results of the suitability for water intake permeability characteristics of the aquifer were analyzed.
Combined with terrain data and K8 measurements,
Long-term hydrological monitoring data were used to the spatial distribution of K4 and K8 was calculated.
determine the seasonal runoff variation patterns during Geological exploration was conducted to determine
the dry season. The dataset covered the period from the distribution range and thickness of continuous
2013 to 2022, with 12 monitoring stations distributed impermeable layers and to evaluate their impact on
across the study area and monthly average values aquifer permeability. For water quality analysis, samples
recorded. The water quality sampling plan included from both river water and groundwater were collected,
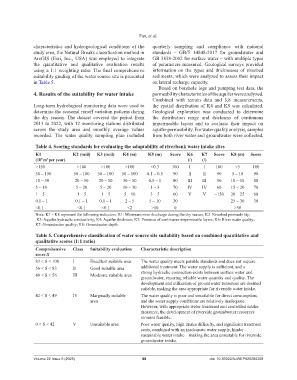
Table 4. Scoring standards for evaluating the adaptability of riverbank water intake sites
K1 K2 (m/d) K3 (m/d) K4 (m) K5 (m) Score K6 K7 Score K8 (m) Score
(10 m per year) (/) (/)
9
3
>150 >100 >100 >100 <0.3 100 Ι Ι 100 <5 100
50 – 150 50 – 100 50 – 100 50 – 100 0.1 – 0.5 90 Ⅱ Ⅱ 90 5 – 10 90
10 – 50 20 – 50 20 – 50 30 – 50 0.5 – 1 80 Ⅲ Ⅲ 80 10 – 15 80
5 – 10 5 – 20 5 – 20 10 – 30 1 – 3 70 Ⅳ Ⅳ 60 15 – 20 70
1 – 5 1 – 5 1 – 5 5 – 10 3 – 5 60 Ⅴ Ⅴ −150 20 – 25 60
0.1 – 1 0.1 – 1 0.1 – 1 2 – 5 5 – 10 30 25 – 30 30
<0.1 <0.1 <0.1 <2 >10 0 >30
Note: K1 – K8 represent the following indicators: K1: Minimum river discharge during the dry season; K2: Riverbed permeability;
K3: Aquifer hydraulic conductivity; K4: Aquifer thickness; K5: Presence of continuous impermeable layers; K6: River water quality;
K7: Groundwater quality; K8: Groundwater depth.
Table 5. Comprehensive classification of water source site suitability based on combined quantitative and
qualitative scores (1:1 ratio)
Comprehensive Class Suitability evaluation Characteristic description
score S
83 < S < 100 Ι Excellent suitable area The water quality meets potable standards and does not require
56 < S < 83 Ⅱ Good suitable area additional treatment. The water supply is sufficient, and a
49 < S < 56 Ⅲ Moderate suitable area strong hydraulic connection exists between surface water and
groundwater, ensuring reliable water quantity and quality. The
development and utilization of groundwater resources are deemed
suitable, making the area appropriate for riverside water intake.
42 < S < 49 Ⅳ Marginally suitable The water quality is poor and unsuitable for direct consumption,
area and the water supply conditions are relatively inadequate.
However, with appropriate water treatment and controlled intake
measures, the development of riverside groundwater resources
remains feasible.
0 < S < 42 Ⅴ Unsuitable area Poor water quality, high intake difficulty, and significant treatment
costs, combined with an inadequate water supply, hinder
sustainable water intake – making the area unsuitable for riverside
groundwater intake.
Volume 22 Issue 5 (2025) 88 doi: 10.36922/AJWEP025260208