
Page 95 - AJWEP-22-5
P. 95
Evaluation of riverbank water suitability
and the comprehensive index method was employed to Based on the established evaluation indicator
assess water quality conditions. system, this study assessed eight quantitative indicators.
A systematic analysis and evaluation of eight key A weighted sum was then calculated using the assigned
indicators were conducted across the study area to weights for each indicator. Qualitative indicators – such
identify optimal zones for riverside water intake. Using as land use type and safety distance – were integrated in
the scoring standards for each indicator, ArcGIS was ArcGIS using a 1:1 weighting ratio. Raster layers were
employed to generate scoring zonation maps for all multiplied to compute the combined suitability. In the
quantitative indicators. In terms of spatial analysis, this resulting output, areas with a value of 0 indicate zones
study provides a detailed explanation of the interpolation unsuitable for the construction of riverside water intake
method (Kriging), grid resolution (50 m × 50 m), and the sites. Finally, the quantitative and qualitative evaluation
logic behind classification and partitioning (Figure 4). results were integrated. Raster data operations in ArcGIS
A B
C D
E F
G H
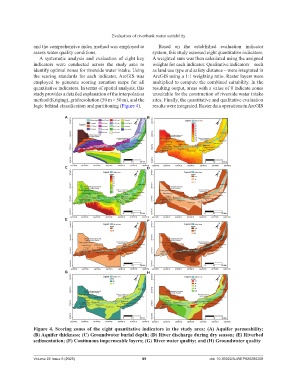
Figure 4. Scoring zones of the eight quantitative indicators in the study area: (A) Aquifer permeability;
(B) Aquifer thickness; (C) Groundwater burial depth; (D) River discharge during dry season; (E) Riverbed
sedimentation; (F) Continuous impermeable layers; (G) River water quality; and (H) Groundwater quality
Volume 22 Issue 5 (2025) 89 doi: 10.36922/AJWEP025260208