
Page 117 - AJWEP-v22i3
P. 117
Farming technologies and food yields in Pakistan
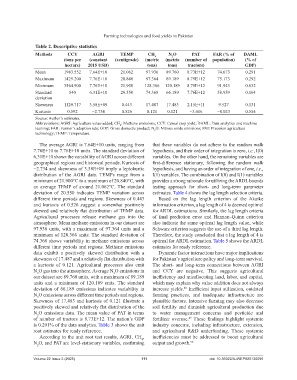
Table 2. Descriptive statistics
Methods CCY AGRI TEMP CH N O PAT FAR (% of DAML
4
2
(tons per (constant (centigrade) (metric (metric (number of population) (% of
hectare) 2015 USD) tons) tons) tractors) GDP)
Mean 1983.552 7.64E+10 21.062 97.936 89.760 8.73E+12 74.673 0.291
Maximum 1429.200 7.76E+10 20.840 97.364 89.189 8.79E+12 75.173 0.292
Minimum 3564.900 7.76E+10 21.900 128.366 120.189 8.79E+12 91.943 0.632
Standard 840 6.31E+10 20.550 74.368 66.189 7.76E+12 58.959 0.164
deviation
Skewness 1129.717 3.58E+09 0.443 17.487 17.483 2.15E+11 9.527 0.131
Kurtosis 0.592 −2.734 0.526 0.121 0.121 −3.416 −0.023 0.554
Source: Author’s estimates.
Abbreviations: AGRI: Agriculture value-added; CH : Methane emissions; CCY: Cereal crop yield; DAML: Data analytics and machine
4
learning; FAR: Farmer’s adoption rate; GDP: Gross domestic product; N O: Nitrous oxide emissions; PAT: Precision agriculture
2
technology; TEMP: Temperature.
The average AGRI is 7.64E+10 units, ranging from that these variables do not adhere to the random walk
7.76E+10 to 7.76E+10 units. The standard deviation of hypothesis, and their order of integration is zero, i.e., I(0)
6.31E+10 shows the variability of AGRI across different variables. On the other hand, the remaining variables are
geographical regions and historical periods. Kurtosis of first-difference stationary, following the random walk
−2.734 and skewness of 3.58E+09 imply a leptokurtic hypothesis, and having an order of integration of one, i.e.,
distribution of the AGRI data. TEMPs range from a I(1) variables. The combination of I(0) and I(1) variables
minimum of 21.900°C to a maximum of 20.840°C, with provides a strong rationale for utilizing the ARDL bounds
an average TEMP of around 21.062°C. The standard testing approach for short- and long-term parameter
deviation of 20.550 indicates TEMP variation across estimates. Table 4 shows the lag length selection criteria.
different time periods and regions. Skewness of 0.443 Based on the lag length criterion of the Akaike
and kurtosis of 0.526 suggest a somewhat positively information criterion, a lag length of 4 is deemed optimal
skewed and relatively flat distribution of TEMP data. for ARDL estimations. Similarly, the lag length criteria
Agricultural processes release methane gas into the of final prediction error and Hannan–Quinn criterion
atmosphere. Mean methane emissions in our dataset are also indicate the same optimal lag length value, while
97.936 units, with a maximum of 97.364 units and a Schwarz criterion suggests the use of a third lag length.
minimum of 128.366 units. The standard deviation of Therefore, the study concluded that a lag length of 4 is
74.368 shows variability in methane emissions across optimal for ARDL estimation. Table 5 shows the ARDL
different time periods and regions. Methane emissions estimates for ready reference.
data exhibit a positively skewed distribution with a Dynamic factor interactions have major implications
skewness of 17.487 and a relatively flat distribution with for Pakistan’s agriculture policy and long-term survival.
a kurtosis of 0.121. Agricultural processes also emit The short- and long-term connections between AGRI
N O gas into the atmosphere. Average N O emissions in and CCY are negative. This suggests agricultural
2
2
our dataset are 89.760 units, with a maximum of 89.189 inefficiency and misallocating land, labor, and capital,
units and a minimum of 120.189 units. The standard which may explain why value addition does not always
deviation of 66.189 emissions indicates variability in increase yields. Inefficient input utilization, outdated
48
N O emissions across different time periods and regions. farming practices, and inadequate infrastructure are
2
Skewness of 17.483 and kurtosis of 0.121 illustrate a plausible factors. Intensive farming may also decrease
positively skewed and relatively flat distribution of the soil fertility and diminish agricultural production due
N O emissions data. The mean value of PAT in terms to water management concerns and pesticide and
2
of number of tractors is 8.73E+12. The nation’s GDP fertilizer overuse. These findings highlight systemic
49
is 0.291% of the data analytics. Table 3 shows the unit industry concerns, including infrastructure, extension,
root estimates for ready reference. and agricultural R&D underfunding. These systemic
According to the unit root test results, AGRI, CH , inefficiencies must be addressed to boost agricultural
4
N O, and PAT are level-stationary variables, confirming output and growth. 50
2
Volume 22 Issue 3 (2025) 111 doi: 10.36922/AJWEP025130096