
Page 118 - AJWEP-v22i3
P. 118
Nabi, et al.
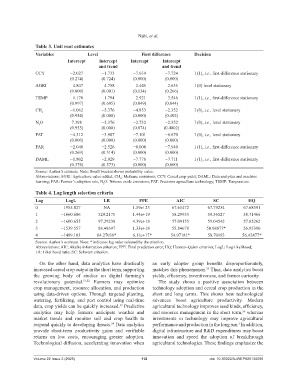
Table 3. Unit root estimates
Variables Level First difference Decision
Intercept Intercept Intercept Intercept
and trend and trend
CCY −2.027 −1.733 −7.639 −7.724 I (1), i.e., first-difference stationary
(0.274) (0.724) (0.000) (0.000)
AGRI −4.847 −4.758 −2.445 −2.635 I (0) level stationary
(0.000) (0.001) (0.134) (0.266)
TEMP −1.170 −1.794 −2.921 −3.546 I (1), i.e., first-difference stationary
(0.997) (0.695) (0.049) (0.044)
CH 4 −1.062 −5.376 −4.853 −2.352 I (0), i.e., level stationary
(0.954) (0.000) (0.000) (0.402)
N O 7.398 −5.376 −2.732 −2.352 I (0), i.e., level stationary
2
(0.955) (0.000) (0.074) (0.4002)
PAT −4.312 −3.987 −7.101 −6.670 I (0), i.e., level stationary
(0.000) (0.000) (0.000) (0.000)
FAR −2.040 −2.526 −8.008 −7.940 I (1), i.e., first-difference stationary
(0.269) (0.314) (0.000) (0.000)
DAML −1.802 −2.029 −7.776 −7.711 I (1), i.e., first-difference stationary
(0.376) (0.573) (0.000) (0.000)
Source: Author’s estimate. Note: Small bracket shows probability value.
Abbreviations: AGRI: Agriculture value-added; CH : Methane emissions; CCY: Cereal crop yield; DAML: Data analytics and machine
4
learning; FAR: Farmer’s adoption rate; N O: Nitrous oxide emissions; PAT: Precision agriculture technology; TEMP: Temperature.
2
Table 4. Lag length selection criteria
Lag LogL LR FPE AIC SC HQ
0 −1955.827 NA 1.59e+23 67.61472 67.79234 67.68391
1 −1660.686 529.2175 1.44e+19 58.29953 59.36527 58.71466
2 −1600.655 97.29230 4.39e+18 57.09155 59.04542 57.85262
3 −1539.557 88.48697 1.33e+18 55.84678 58.68877* 56.95380
4 −1489.183 64.27038* 6.11e+17* 54.97181* 58.70193 56.42477*
Source: Author’s estimate. Note: * indicates lag order selected by the criterion.
Abbreviations: AIC: Akaike information criterion; FPE: Final prediction error; HQ: Hannan–Quinn criterion; LogL: Log-likelihood;
LR: Likelihood ratio; SC: Schwarz criterion.
On the other hand, data analytics have drastically an early adopter group benefits disproportionately,
increased cereal crop output in the short term, supporting matches this phenomenon. Thus, data analytics boost
55
the growing body of studies on digital farming’s yields, efficiency, inventiveness, and farmer curiosity.
revolutionary potential. 51,52 Farmers may optimize The study shows a positive association between
crop management, resource allocation, and production technology adoption and cereal crop production in the
using data-driven options. Through targeted planting, short and long terms. This shows how technological
watering, fertilizing, and pest control using real-time advances boost agriculture productivity. Modern
data, crop yields can be quickly increased. Predictive agricultural technology improves seed kinds, efficiency,
53
analytics may help farmers anticipate weather and and resource management in the short term, whereas
56
market trends and monitor soil and crop health to investments in technology may improve agricultural
respond quickly to developing threats. Data analytics performance and production in the long run. In addition,
5
54
provide short-term productivity gains and verifiable digital infrastructure and R&D expenditures may boost
returns on low costs, encouraging greater adoption. innovation and speed the adoption of breakthrough
Technological diffusion, accelerating innovation when agricultural technologies. These findings emphasize the
Volume 22 Issue 3 (2025) 112 doi: 10.36922/AJWEP025130096