
Page 115 - AJWEP-v22i3
P. 115
Farming technologies and food yields in Pakistan
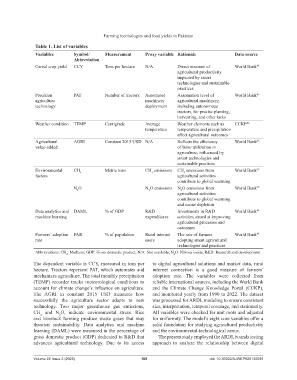
Table 1. List of variables
Variables Symbol/ Measurement Proxy variable Rationale Data source
Abbreviation
Cereal crop yield CCY Tons per hectare N/A Direct measure of World Bank 45
agricultural productivity
impacted by smart
technologies and sustainable
practices
Precision PAT Number of tractors Automated Automation level of World Bank 45
agriculture machinery agricultural machinery,
technology deployment including autonomous
tractors, for precise planting,
harvesting, and other tasks
Weather condition TEMP Centigrade Average Weather elements such as CCKP 46
temperature temperature and precipitation
affect agricultural outcomes
Agricultural AGRI Constant 2015 USD N/A Reflects the efficiency World Bank 45
value-added of labor utilization in
agriculture, influenced by
smart technologies and
sustainable practices
Environmental CH 4 Metric tons CH emissions CH emissions from World Bank 45
4
4
factors agricultural activities
contribute to global warming
N O N O emissions N O emissions from World Bank 45
2
2
2
agricultural activities
contribute to global warming
and ozone depletion
Data analytics and DAML % of GDP R&D Investments in R&D World Bank 45
machine learning expenditures activities aimed at improving
agricultural processes and
outcomes
Farmers’ adoption FAR % of population Rural internet The rate of farmers World Bank 45
rate users adopting smart agricultural
technologies and practices
Abbreviations: CH : Methane; GDP: Gross domestic product; N/A: Not available; N O: Nitrous oxide; R&D: Research and development.
4 2
The dependent variable is CCY, measured in tons per to digital agricultural solutions and market data, rural
hectare. Tractors represent PAT, which automates and internet connection is a good measure of farmers’
mechanizes agriculture. The total monthly precipitation adoption rate. The variables were collected from
(TEMP) recorder tracks meteorological conditions to reliable international sources, including the World Bank
account for climate change’s influence on agriculture. and the Climate Change Knowledge Portal (CCKP),
The AGRI in constant 2015 USD measures how and monitored yearly from 1990 to 2022. The dataset
successfully the agriculture sector adapts to new was processed for ARDL modeling to ensure consistent
technology. Two major greenhouse gas emissions, size, interpretation, temporal coverage, and stationarity.
CH and N O, indicate environmental stress. Rice All variables were checked for unit roots and adjusted
4
2
and livestock farming produce waste gases that may for uniformity. The model’s eight core variables offer a
threaten sustainability. Data analytics and machine solid foundation for studying agricultural productivity
learning (DAML) were measured in the percentage of and the environmental-technological nexus.
gross domestic product (GDP) dedicated to R&D that The present study employed the ARDL bounds testing
advances agricultural technology. Due to its access approach to analyze the relationship between digital
Volume 22 Issue 3 (2025) 109 doi: 10.36922/AJWEP025130096