
Page 86 - ARNM-2-3
P. 86
Advances in Radiotherapy
& Nuclear Medicine OrthoCT experimental proof of concept
Table 1. Determination of the relative gain of each channel: Value obtained for each irradiation position and the corresponding
average
Position 1 Irradiation # Channel 1 Channel 2 Channel 3 Channel 4
1 1030.94 865.85 760.38 860.28
2 1037.98 867.30 760.27 867.34
3 1035.00 866.08 762.08 862.40
4 1034.38 871.09 756.20 861.28
5 1035.38 866.77 759.73 861.21
Average 1034.74 867.42 759.73 862.50
Position 2 1 1043.04 875.81 763.28 868.45
2 1043.13 875.51 762.99 870.87
3 1035.89 879.55 763.80 873.44
4 1035.89 875.89 762.01 875.11
5 1040.27 881.16 771.06 873.38
Average 1039.64 877.59 764.63 877.25
This means that using channel 1 as the reference, the
values obtained for channels 2, 3, and 4 must be multiplied
by 1.1791, 1.3376, and 1.1650, respectively, to calibrate the
relative gains. It should be noted that as the position of
the phantom varies, the geometry of the system changes,
including the distance from the source to the surface of the
phantom. In addition, the cross-sectional area of the beam
changes due to its divergence. This could potentially change
the relative gain between the two channels. However, the
induced variations were considered to be minimal and
therefore were not taken into account in the approach used
to calculate the relative gains.
3.2. Longitudinal scan along the phantom
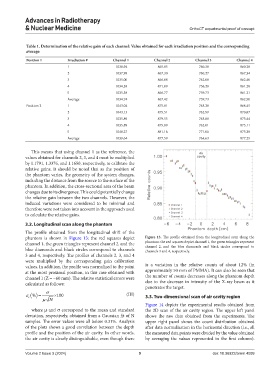
The profile obtained from the longitudinal shift of the
phantom is shown in Figure 13: the red squares depict Figure 13. The profile obtained from the longitudinal scan along the
channel 1, the green triangles represent channel 2, and the phantom: the red squares depict channel 1, the green triangles represent
channel 2, and the blue diamonds and black circles correspond to
blue diamonds and black circles correspond to channels channels 3 and 4, respectively.
3 and 4, respectively. The profiles of channels 2, 3, and 4
were multiplied by the corresponding gain calibration
values. In addition, the profile was normalized to the point is a variation in the relative counts of about 12% (in
at the most proximal position, in this case obtained with approximately 50 mm of PMMA). It can also be seen that
channel 1 (Z = −60 mm). The relative statistical errors were the number of counts decreases along the phantom depth
calculated as follows: due to the decrease in intensity of the X-ray beam as it
penetrates the target.
σ
ε ( ) =% × 100 (III) 3.3. Two-dimensional scan of air cavity region
r
µ N
Figure 14 depicts the experimental results obtained from
where µ and σ correspond to the mean and standard the 2D scan of the air cavity region. The upper left panel
deviation, respectively, obtained from a Gaussian fit of N shows the raw data obtained from the experiments. The
samples. The error values were all below 0.31%. Analysis upper right panel shows the count distribution obtained
of the plots shows a good correlation between the depth after data normalization in the horizontal direction (i.e., all
profile and the position of the air cavity. In other words, the measured data points were divided by the value obtained
the air cavity is clearly distinguishable, even though there by averaging the values represented in the first column).
Volume 2 Issue 3 (2024) 9 doi: 10.36922/arnm.4099