
Page 88 - ARNM-2-3
P. 88
Advances in Radiotherapy
& Nuclear Medicine OrthoCT experimental proof of concept
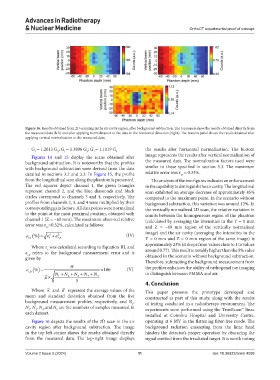
Figure 16. Results obtained from 2D scanning in the air cavity region, after background subtraction. The top panels show the results obtained directly from
the measured data (left) and after applying normalization to the data in the horizontal direction (right). The bottom panel shows the result obtained after
applying vertical normalization to the measured data.
G = 1.2013 G ; G = 1.3896 G ; G = 1.1019 G the results after horizontal normalization. The bottom
1 2 1 3 1 4
Figures 14 and 15 display the scans obtained after image represents the results after vertical normalization of
background subtraction. It is noteworthy that the profiles the measured data. The normalization factors used were
with background subtraction were derived from the data similar to those specified in section 3.3. The maximum
detailed in sections 3.2 and 3.3. In Figure 15, the profile relative error was = 0.33%.
r,t
from the longitudinal scan along the phantom is presented. The analysis of the two figures indicates an enhancement
The red squares depict channel 1, the green triangles in the capability to distinguish the air cavity. The longitudinal
represent channel 2, and the blue diamonds and black scan exhibited an average decrease of approximately 45%
circles correspond to channels 3 and 4, respectively. The compared to the maximum point. In the scenario without
profiles from channels 2, 3, and 4 were multiplied by their background subtraction, this variation was around 12%. In
corresponding gain factors. All data points were normalized the vertically normalized 2D scan, the relative variation in
to the point at the most proximal position, obtained with counts between the homogeneous region of the phantom
channel 1 (Z = −60 mm). The maximum observed relative (calculated by averaging the intensities in the Y = 0 mm
error was =0.32%, calculated as follows:
r,t and Z = −60 mm region of the vertically normalized
ε rt , ( ) =% ε r 2 ε + 2 , rb (IV) image) and the air cavity (averaging the intensities in the
Y = 0 mm and Z = 0 mm region of the same image) is
Where was calculated according to Equation III, and approximately 23% (it drops from values close to 1 to values
r
refers to the background measurement error and is around 0.77). This result is notably higher than the 5% value
r,b
given by obtained in the scenario without background subtraction.
Therefore, subtracting the background measurement from
σ the profiles enhances the ability of orthogonal ray imaging
( ) =
ε % ×100 (V) to distinguish between PMMA and air.
, rb
µ × 1 + N 2 + N 3 + N 4 + N N 5
5
4. Conclusion
Where ∝ and σ represent the average values of the This paper presents the prototype developed and
mean and standard deviation obtained from the five constructed as part of this study, along with the results
background measurement profiles, respectively, and N , of testing conducted in a radiotherapy environment. The
1
N , N , N ,andN are the numbers of samples measured in experiments were performed using the TrueBeam™ linac
5
2
4
3
each dataset.
installed at Coimbra Hospital and University Centre,
Figure 16 depicts the results of the 2D scan in the air operating at 6 MV in the flattening filter-free mode. The
cavity region after background subtraction. The image background radiation emanating from the linac head
in the top left corner shows the results obtained directly hinders the detector’s proper operation by obscuring the
from the measured data. The top-right image displays signal emitted from the irradiated target. It is worth noting
Volume 2 Issue 3 (2024) 11 doi: 10.36922/arnm.4099