
Page 87 - ARNM-2-3
P. 87
Advances in Radiotherapy
& Nuclear Medicine OrthoCT experimental proof of concept
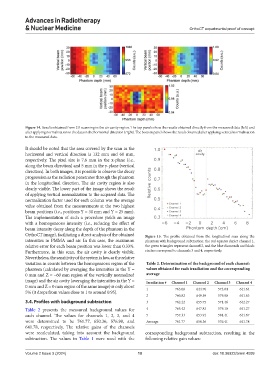
Figure 14. Results obtained from 2D scanning in the air cavity region. The top panels show the results obtained directly from the measured data (left) and
after applying normalization to the data in the horizontal direction (right). The bottom panel shows the result obtained after applying vertical normalization
to the measured data.
It should be noted that the area covered by the scan in the
horizontal and vertical direction is 132 mm and 60 mm,
respectively. The pixel size is 7.6 mm in the x-plane (i.e.,
along the beam direction) and 5 mm in the y-plane (vertical
direction). In both images, it is possible to observe the decay
progression as the radiation penetrates through the phantom
in the longitudinal direction. The air cavity region is also
clearly visible. The lower part of the image shows the result
of applying vertical normalization to the acquired data. The
normalization factor used for each column was the average
value obtained from the measurements at the two highest
beam positions (i.e., positions Y = 30 mm and Y = 25 mm).
The implementation of such a procedure yields an image
with a homogeneous intensity (i.e., reducing the effect of
beam intensity decay along the depth of the phantom in the
OrthoCT image), facilitating a direct analysis of the obtained Figure 15. The profile obtained from the longitudinal scan along the
intensities in PMMA and air. In this case, the maximum phantom with background subtraction: the red squares depict channel 1,
relative error for each beam position was lower than 0.33%. the green triangles represent channel 2, and the blue diamonds and black
Furthermore, in this scan, the air cavity is clearly visible. circles correspond to channels 3 and 4, respectively.
Nevertheless, the sensitivity of the system is low, as the relative
variation in counts between the homogeneous region of the Table 2. Determination of the background of each channel:
phantom (calculated by averaging the intensities in the Y = values obtained for each irradiation and the corresponding
0 mm and Z = −60 mm region of the vertically normalized average
image) and the air cavity (averaging the intensities in the Y = Irradiation # Channel 1 Channel 2 Channel 3 Channel 4
0 mm and Z = 0 mm region of the same image) is only about 1 763.08 644.70 573.04 641.64
5% (it drops from values close to 1 to around 0.95).
2 760.82 649.59 579.90 641.63
3.4. Profiles with background subtraction 3 762.22 655.75 571.46 642.27
Table 2 presents the measured background values for 4 765.42 647.83 579.10 641.27
each channel. The values for channels 1, 2, 3, and 4 5 757.33 653.91 581.41 641.67
were determined to be 761.77, 650.36, 576.98, and Average 761.77 650.36 576.41 641.78
641.78, respectively. The relative gains of the channels
were recalculated, taking into account the background corresponding background subtraction, resulting in the
subtraction. The values in Table 1 were used with the following relative gain values:
Volume 2 Issue 3 (2024) 10 doi: 10.36922/arnm.4099