
Page 19 - BH-2-1
P. 19
Brain & Heart Pictorial rendition pulmonary stenosis
A B
Figure 3. In patients with a pulmonary valve annulus that is too big to
be dilated with one balloon, two balloons may be positioned through
the pulmonary valve to perform balloon dilatation. (A) The waisting of
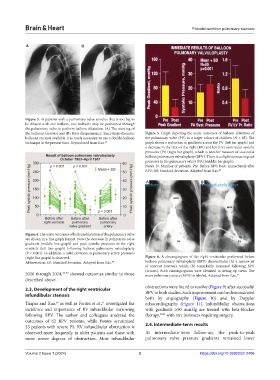
the balloons (arrows) and (B) their disappearance. Since large-diameter Figure 5. Graph depicting the acute outcomes of balloon dilatation of
balloons are now available, it is rarely necessary to use a double-balloon the pulmonary valve (PV) in a larger cohort of children (N = 85). The
technique at the present time. Reproduced from Rao. 19 graph shows a reduction in gradients across the PV (left bar graph) and
a decrease in the ratio of the right (RV) and left (LV) ventricular systolic
pressures (Pr) (right bar graph), which is another measure of successful
balloon pulmonary valvuloplasty (BPV). There is a slight increase in peak
pressures in the pulmonary artery (PA) (middle bar graph).
Notes: N: Number of patients; Pre: Before BPV; Post: Immediately after
BPV; SD: Standard deviation. Adopted from Rao. 49
A B
Figure 4. The acute outcomes of balloon dilatation of the pulmonary valve
are shown in a line graph format. Note the decrease in pulmonary valve
gradients (middle line graph) and peak systolic pressures in the right
ventricle (left line graph) following balloon pulmonary valvuloplasty
(P < 0.001). In addition, a mild elevation in pulmonary artery pressures
(right line graph) is observed. Figure 6. A cineangiogram of the right ventricular performed before
Abbreviation: SD: Standard deviation. Adopted from Rao. 48 balloon pulmonary valvuloplasty (BPV) demonstrates (A) a narrow jet
of contrast (arrows), which (B) remarkably increased following BPV
(arrows). Both cineangiograms were obtained in sitting-up views. The
2020 through 2024, 43-47 showed outcomes similar to those main pulmonary artery (MPA) is labeled. Adopted from Rao. 19
described above.
2.3. Development of the right ventricular obstructions were found to resolve (Figure 9) after successful
infundibular stenosis BPV in both studies. Such improvement can be demonstrated
both by angiography (Figure 10) and by Doppler
Thapar and Rao, as well as Fontes et al., investigated the echocardiography (Figure 11). Infundibular obstructions
50
51
incidence and importance of RV infundibular narrowing with gradients ≥50 mmHg are treated with beta-blocker
following BPV. The author and colleagues analyzed the therapy, 50,51 with rare instances requiring surgery.
outcomes of 62 BPV patients, while Fontes scrutinized
33 patients with severe PS. RV infundibular obstruction is 2.4. Intermediate-term results
observed more frequently in older patients and those with At intermediate-term follow-up, the peak-to-peak
more severe degrees of obstruction. Most infundibular pulmonary valve pressure gradients remained lower
Volume 2 Issue 1 (2024) 3 https://doi.org/10.36922/bh.2406