
Page 21 - BH-2-1
P. 21
Brain & Heart Pictorial rendition pulmonary stenosis
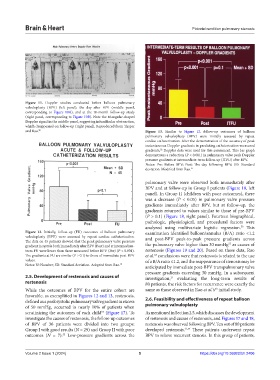
Figure 11. Doppler studies conducted before balloon pulmonary
valvuloplasty (BPV) (left panel), the day after BPV (middle panel,
corresponding to Figure 10A), and at the 10-month follow-up study
(right panel, corresponding to Figure 10B). Note the triangular-shaped
Doppler signal in the middle panel, suggesting infundibular obstruction,
which disappeared on follow-up (right panel). Reproduced from Thapar
and Rao. 50 Figure 13. Similar to Figure 12, follow-up outcomes of balloon
pulmonary valvuloplasty (BPV) were initially assessed by repeat
cardiac catheterization. After the demonstration of the accuracy of peak
instantaneous Doppler gradients in predicting catheterization-measured
gradients, Doppler data were used for this assessment. This bar graph
52
demonstrates a reduction (P < 0.001) in pulmonary valve peak Doppler
pressure gradients at intermediate-term follow-up (ITFU) after BPV.
Notes: Pre: Before BPV; Post: The day following BPV; SD: Standard
deviation. Modified from Rao. 21
pulmonary valve were observed both immediately after
BPV and at follow-up in Group I patients (Figure 18, left
panel). In Group II (children with poor outcomes), there
was a decrease (P < 0.05) in pulmonary valve pressure
gradients immediately after BPV, but at follow-up, the
gradients returned to values similar to those of pre-BPV
(P > 0.1) (Figure 18, right panel). Fourteen biographical,
pathologic, physiological, and procedural factors were
analyzed using multivariate logistic regression. This
53
Figure 12. Initially, follow-up (FU) outcomes of balloon pulmonary examination identified balloon/annulus (B/A) ratio <1.2
valvuloplasty (BPV) were assessed by repeat cardiac catheterization. and post-BPV peak-to-peak pressure gradients across
The data on 45 patients showed that the peak pulmonary valve pressure 53
gradient in systole both immediately after BPV (Post) and at intermediate- the pulmonary valve higher than 30 mmHg as causes of
term FU were lower than those measured before BPV (Pre) (P < 0.001). restenosis (Figures 19 and 20). Based on these data, Rao
53
The gradients at FU are similar (P > 0.1) to those of immediate post-BPV et al. conclusions were that restenosis is related to the use
values. of a B/A ratio ≤1.2, and the reappearance of stenosis may be
Notes: N: Number; SD: Standard deviation. Adopted from Rao. 19
anticipated by immediate post-BPV transpulmonary valve
pressure gradients exceeding 30 mmHg. In a subsequent
2.5. Development of restenosis and causes of investigation, evaluating the long-term results of
21
restenosis 80 patients, the risk factors for recurrence were exactly the
While the outcomes of BPV for the entire cohort are same as those observed in Rao et al.’s initial study.
53
favorable, as exemplified in Figures 12 and 13, restenosis,
defined as a peak systolic pulmonary valve gradient in excess 2.6. Feasibility and effectiveness of repeat balloon
of 50 mmHg, occurred in nearly 10% of patients when pulmonary valvuloplasty
scrutinizing the outcomes of each child (Figure 17). To As mentioned in Section 2.5, which discusses the development
53
investigate the causes of restenosis, the follow-up outcomes of restenosis and causes of restenosis, and Figures 17 and 18,
of BPV of 36 patients were divided into two groups: restenosis was observed following BPV. Ten out of 80 patients
Group I with good results (N = 29) and Group II with poor developed restenosis. 21,54 These patients underwent repeat
outcomes (N = 7). Low-pressure gradients across the BPV to relieve recurrent stenosis. In this group of patients,
53
Volume 2 Issue 1 (2024) 5 https://doi.org/10.36922/bh.2406