
Page 23 - BH-2-1
P. 23
Brain & Heart Pictorial rendition pulmonary stenosis
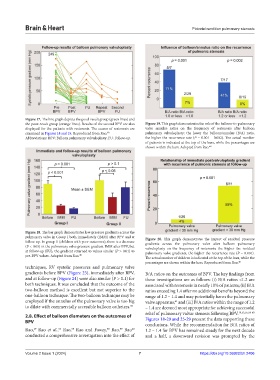
Figure 17. The line graph depicts the good-result group (green lines) and
the poor-result group (orange lines). Results of the second BPV are also Figure 19. This graph demonstrates the role of the balloon-to-pulmonary
displayed for the patients with restenosis. The causes of restenosis are valve annulus ratios on the frequency of restenosis after balloon
examined in Figures 18 and 19. Reproduced from Rao. 48 pulmonary valvuloplasty; the lower the balloon/annulus (B/A) ratio,
Abbreviations: BPV: Balloon pulmonary valvuloplasty; FU: Follow-up. the higher the recurrence rate (P = 0.001 – 0.002). The actual number
of patients is indicated at the top of the bars, while the percentages are
shown within the bars. Adopted from Rao. 48
Figure 18. The bar graph demonstrates low-pressure gradients across the
pulmonary valve in Group I both immediately (IMM) after BPV and at Figure 20. This graph demonstrates the impact of residual pressure
follow-up. In group II (children with poor outcomes), there is a decrease gradients across the pulmonary valve after balloon pulmonary
(P < 0.05) in the pulmonary valve pressure gradient IMM after BPV, but valvuloplasty on the frequency of restenosis; the higher the residual
at follow-up (FU), the gradient returned to values similar (P > 0.01) to pulmonary valve gradients, the higher the recurrence rate (P = 0.001).
pre-BPV values. Adopted from Rao. 48
The actual number of children is indicated at the top of the bars, while the
percentages are shown within the bars. Reproduced from Rao. 48
techniques, RV systolic pressures and pulmonary valve
gradients before BPV (Figure 23), immediately after BPV, B/A ratios on the outcomes of BPV. The key findings from
and at follow-up (Figure 24) were also similar (P > 0.1) for these investigations are as follows: (i) B/A ratios <1.2 are
both techniques. It was concluded that the outcome of the associated with restenosis in nearly 10% of patients; (ii) B/A
two-balloon method is excellent but not superior to the ratios exceeding 1.4 offer no additional benefits beyond the
one-balloon technique. The two-balloon technique may be range of 1.2 – 1.4 and may potentially harm the pulmonary
employed if the annulus of the pulmonary valve is too big valve apparatus; and (iii) B/A ratios within the range of 1.2
61
to dilate with commercially accessible balloon catheters. 58 – 1.4 are deemed most appropriate for achieving successful
relief of pulmonary valvar stenosis following BPV. 19,53,55,58-60
2.8. Effect of balloon diameters on the outcomes of Figures 18-20 and 25-29 present the data supporting these
BPV
conclusions. While the recommendation for B/A ratios of
Rao, Rao et al., Rao, Rao and Fawzy, Rao, Rao 1.2 – 1.4 for BPV has remained steady for the next decade
60
53
19
55
59
58
conducted a comprehensive investigation into the effect of and a half, a downward revision was prompted by the
Volume 2 Issue 1 (2024) 7 https://doi.org/10.36922/bh.2406