
Page 26 - BH-2-1
P. 26
Brain & Heart Pictorial rendition pulmonary stenosis
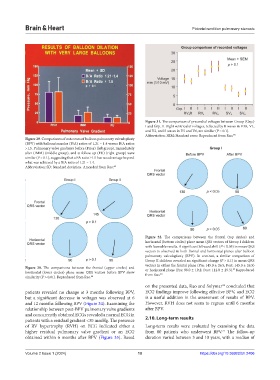
Figure 31. The comparison of precordial voltages between Group (Grp.)
I and Grp. II. Right ventricular voltages, reflected by R waves in V3R, V1,
and V2, and S waves in V5 and V6, are similar (P > 0.1).
Abbreviation: SEM: Standard error. Reproduced from Rao. 48
Figure 29. Comparisons of outcomes of balloon pulmonary valvuloplasty
(BPV) with balloon/annulus (B/A) ratios of 1.21 – 1.4 versus B/A ratios
>1.5. Pulmonary valve gradients before (Prior) (left group), immediately
after (IMM) (middle group), and at follow-up (FU) (right group) were
similar (P > 0.1), suggesting that a BA ratio ≥1.5 has no advantage beyond
what was achieved by a B/A ratio of 1.21 – 1.4.
Abbreviation: SD: Standard deviation. Amended from Rao. 60
Figure 32. The comparisons between the frontal (top circles) and
horizontal (bottom circles) plane mean QRS vectors of Group I children
with favorable results. A significant leftward shift (P < 0.05) in mean QRS
vectors is observed in both frontal and horizontal planes after balloon
pulmonary valvuloplasty (BPV). In contrast, a similar comparison of
Group II children revealed no significant change (P > 0.1) in mean QRS
vectors in either the frontal plane (Pre: 145.0 ± 26.5; Post: 145.0 ± 26.5)
Figure 30. The comparisons between the frontal (upper circles) and or horizontal plane (Pre: 98.0 ± 19.2; Post: 112.0 ± 29.3). Reproduced
57
horizontal (lower circles) plane mean QRS vectors before BPV show from Rao. 48
similarity (P > 0.01). Reproduced from Rao. 48
on the presented data, Rao and Solymar concluded that
62
patients revealed no change at 3 months following BPV, ECG findings improve following effective BPV, and ECG
but a significant decrease in voltages was observed at 6 is a useful addition in the assessment of results of BPV.
and 12 months following BPV (Figure 34). Examining the However, RVH does not seem to regress until 6 months
relationship between post-BPV pulmonary valve gradients after BPV.
and concurrently obtained ECGs revealed a normal ECG in
patients with a residual gradient <30 mmHg. The presence 2.10. Long-term results
of RV hypertrophy (RVH) on ECG indicated either a Long-term results were evaluated by examining the data
higher residual pulmonary valve gradient or an ECG from 80 patients who underwent BPV. The follow-up
21
obtained within 6 months after BPV (Figure 35). Based duration varied between 3 and 10 years, with a median of
Volume 2 Issue 1 (2024) 10 https://doi.org/10.36922/bh.2406